Logs
Logs section enables you to view data sync between the devices of the client and the Enterprise Datasource server.
Trace Log
Note: The Trace Log Level is OFF initially when you install Kony Sync Server. On the Trace Logs page, click the click here link to navigate to the Configuration tab. You may select ON from the Trace Log Level drop-down to turn on the trace logs.
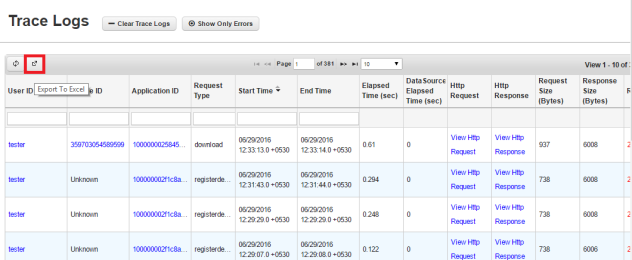
Trace Log feature enables you to view request and response data between the clients and Enterprise Datasource Server for a particular Application, User, Device and Time combination.

You may click Clear Trace Logs to clear the trace logs, and may click Show Only Errors to show only error logs.
Export to Excel
You can export the logs from the Console database to an Excel file format. To export the logs, follow these steps:
- Click the Export to Excel button to export the log data to Excel.
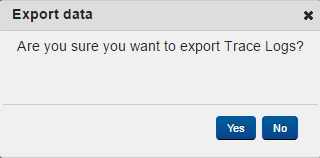
- The following pop-up window is displayed.
- Click Yes to export the logs to Excel. Otherwise, click No.
- Click on Yes button. The Trace Logs Excel file is downloaded to your system. The following table describes the outcome of the data exported.
- Click on the hyperlink displayed against each field in the Http Request, Http Response, DS Http Request, DS Http Response and Error Message columns to view the complete details of the selected field.
- Click on the plus symbol on the right of each log displayed for additional details.
- If the export operation fails because of an error, the console displays a message explaining the cause of the error.
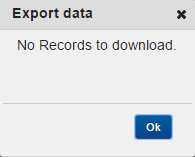
- If you do not have any logs to export, console displays a message as there are no records to export.


Kony Fabric Sync Services Log
Kony Fabric Sync Services log feature enables you to view various levels of the Kony Fabric Sync Server Services and Kony Fabric Sync Console log data like DEBUG, INFO and ERROR on UI.
Configuration
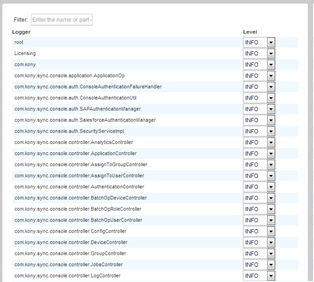
Using Configuration UI, Administrator can configure the level data that is required to monitor the logged data on the Kony Fabric Sync services server.
Log
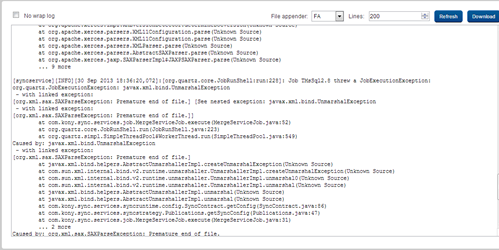
Log feature enables you to download the log file, view the number of lines in the log file that helps in quickly viewing the logs from UI, especially the exceptions and followed by quick resolutions.
Kony Fabric Sync Console Log
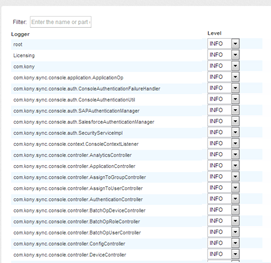
Using Configuration helps you to configure the level data that is required to monitor the logged data on the Kony Fabric Sync console.
Configuration
Using Configuration feature, an Administrator can configure the level data that is required to monitor the logged data on the Kony Fabric Sync services server.
Log
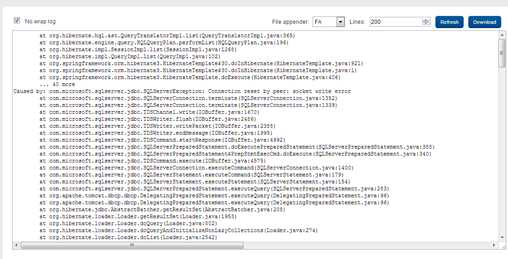
Log feature enables the Administrator to download the log file, view the number of lines in the log file. This helps in quickly viewing the logs from UI, especially the exceptions followed by quick resolutions.
| Rev | Author | Edits |
| 7.1 | GS | GS |
| Copyright © 2012 Kony, Inc. All rights reserved. |
