Kony Fabric Sync Console User Guide: Analytics Dashboard
Analytics Dashboard
Analytics Dashboard is the landing page of the application. This feature enables you to view the system performance based on various criteria for a selected duration of time interval.
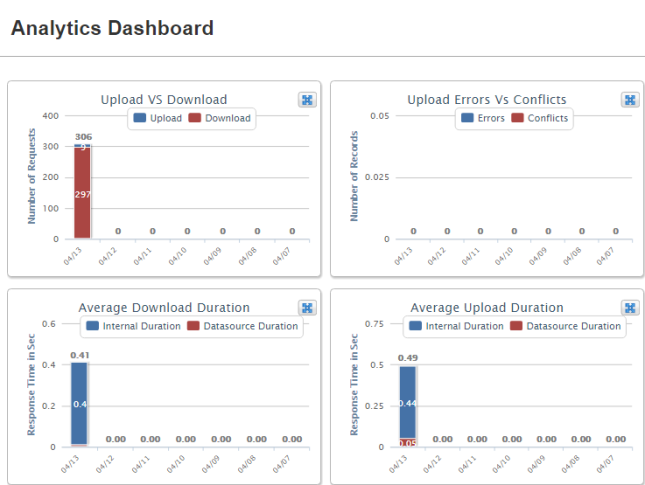
The four different reports that you can view are:
- Upload versus Replica
- Number of Sync Errors versus Conflicts
- Avg Download Response Time
- Avg Upload Response Time
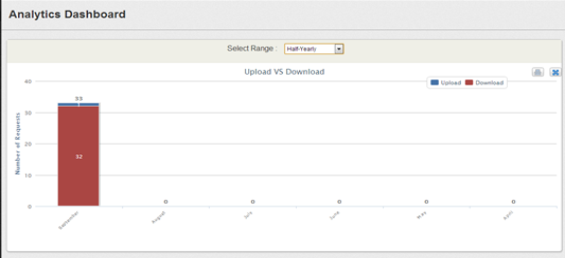
By clicking the Maximize button on any given report, the drop-down for choosing period appears as shown. You can view the data on a weekly, monthly, half-yearly and yearly basis.
Note: You cannot view the graphs when the respective tabs are not populated with data.
| Copyright © 2012 Kony, Inc. All rights reserved. |