
Monitor an App's Performance
With Quantum Visualizer, you can conduct application performance monitoring (APM) so that you can evaluate the performance of your app and use the feedback as the basis for improving its performance. This topic only covers how to activate APM in Quantum Visualizer. Capturing events and tracing the user journey through an app is handled by Quantum Fabric. For more information on customizing and using APM, refer Quantum Fabric Reporting and Analytics.
NOTE: From Quantum Visualizer V8 SP4 Fixpack 20 onwards, APM events are supported in Quantum Visualizer. However, APM is not supported for the Run Live Preview and Publish Live Preview features in Quantum Visualizer.
To activate APM, do the following:
- In Quantum Visualizer: From the Project menu, click Settings. The Project Settings window appears. Click the Metrics APM tab.
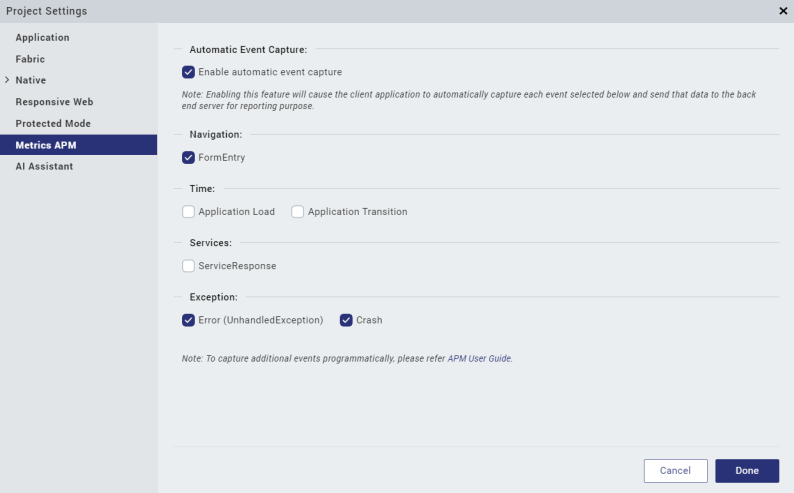
- Activate APM by selecting the Enable automatic event capture check box.
- Configure the extent of the APM activity by setting the following types of events.
- Navigation: To capture when the user enters a form, check FormEntry.
- Time: To capture the time the application takes to load, check Application Load. To capture the time the application takes to execute any transitions, check Application Transition.
- Services: To capture when the app receives a response from a service, check ServiceResponse.
- Exceptions: To capture when an unhandled error exception takes place, check Error. To capture when the app crashes, check Crash.
- Click Done.