
Use Data & Services Panel Features
Use Sample Services
This section provides information on how to discover and use existing sample services in an app.
In Visualizer, a set of sample Integration and Object services are bundled. These services are uploaded to Quantum Fabric when the sample data is dragged onto a form. When you drag and drop a sample service operation on a form, a project service is added. This is the operation with which the view mapping action is associated.
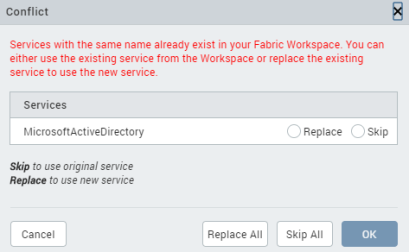
If the sample service that you are trying to create already exists, a Conflict window appears. You must perform any one of the following actions:
- Select the Skip radio button, and then click Ok to use the original service.
- If multiple instances of the same service exist and you want to use the original service, click Skip All.
- Select the Replace radio button, and then click Ok to use a new service.
- If multiple instances of the same service exist and you want to use a new service, click Replace All.
If any services are already associated to your Quantum Fabric application, you can view them in the Data & Services panel. You can drag and drop these services on to various widgets in a form. When you perform the drag and drop action, the code is auto-generated to bind the UI element to the back-end service.
The type of code generated depends on:
- The type of service that is being created (GET, POST, DELETE, UPDATE)
- The type of widget it is being mapped to
- Once a data widget is linked to the Post Operation, the data is sent based on test parameters and not based on the label's text value.
You can use the following types of sample services and bind them to various forms in your application:
- Use a Sample Identity Service
- Use a Sample Integration Service
- Use a Sample Object Service
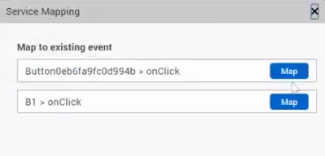
NOTE: If you invoke the same service and operation on any action in a form or its child widgets, the mapping gets added to that service call. If multiple such service calls exist, you must select the service call to which you want to add the mapping.
Use a Sample Identity Service
You can view Identity services in the Data & Services panel. You can also set up new Identity services. Once you configure the Identity service, you can view the request and response parameters in the Data & Services panel.
The login credentials for the bundled sample Identity service are as follows:
- User ID: testuser@samples.kony.com
- Password: test@123
To use a sample Identity service, do the following:
- In Quantum Visualizer, create a new project or open an existing one.
- Create a form; for example, frmSample.
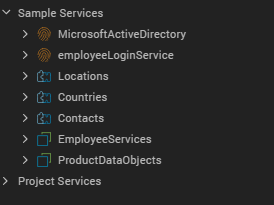
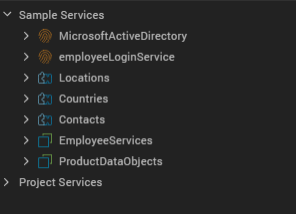
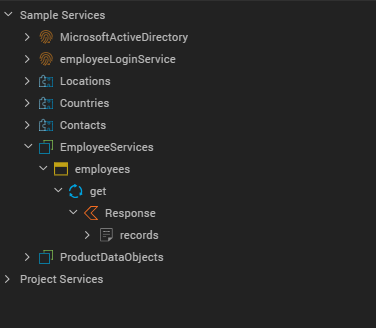
- From the Data & Services panel, click Sample Services. The list of pre-configured services appears.
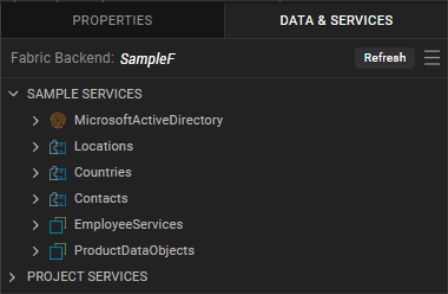
- Expand MicrosoftActiveDirectory; the login and logout services appear.
- Drag and drop the login service on to the form.
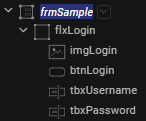
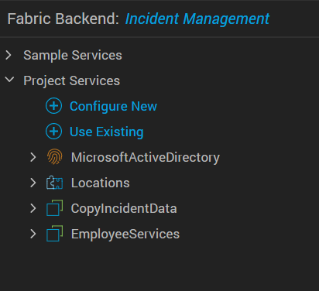
- Post this action, widgets are added to the form and the Identity service is associated with the form. The service also appears under Project Services in an auto-highlighted state. Here, the MicrosoftActiveDirectory service is auto-highlighted.

You can expand the login service to view its Request parameters. The mapped parameters of any service appear in a bold and italics style to differentiate from unmapped parameters. Here, userid and password are displayed in a bolded and italicized manner.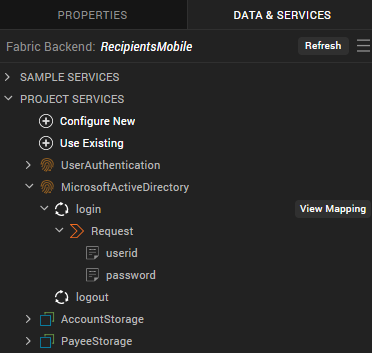
You can also click View Mapping to view the mapping details of the login service in the Action Editor. The specific operation of the service is auto-highlighted in the Action Editor. Click Generate Code to view all the mappings of the login operation.
Dragging and dropping operations onto the form leads to the auto-generation of UI elements.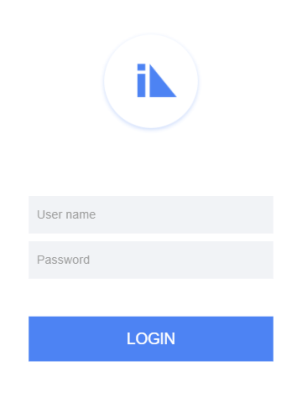
Use a Sample Integration Service
You can view Integration services in the Data Panel. You can also set up new data sources. Once you configure the Integration service, you can view the request and response parameters in the Data & Services panel.
To use a sample Integration service, do the following:
- In Quantum Visualizer, create a new project or open an existing one.
- Create a form; for example, frmSample.
- From the Data & Services panel, select Sample Services. The list of pre-configured services appears.
- Expand any Integration service. Here, Locations, Countries, and Contacts are the sample Integration services.
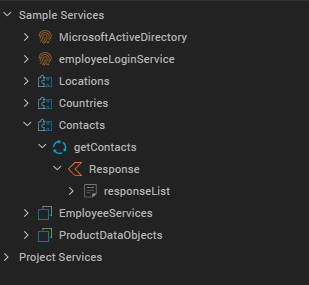
- Expand any service to view its available Request or Response parameter. The respective responseList or requestList is auto-displayed. Here, Contacts > getContacts > Response > responseList.
- You can perform any of the following actions:
- Drag and drop the service onto your form.
A dialog box appears asking you to generate either a List, or a Details, or an Entry form. You can select any of the three options as follows:- List Using Response: If the response contains a collection, a Segment is added to the parent form. This Segment is mapped to the Response parameter of the service.
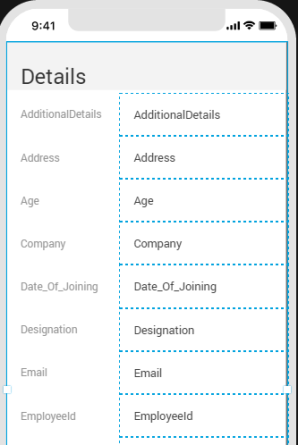
- Details Using Response: A FlexContainer with Labels is added. These Labels are mapped to the Response parameter of the service.
- Entry form for Request: A FlexScrollContainer containing TextBoxes and Labels is added. The TextBoxes are mapped to the Request parameter of the operation.
- Alternatively, you can directly drag and drop either the Response or Request parameter of the service onto the form:
- Drag and drop Response parameter: If a service invocation already exists in the form, the Response parameter is added to the mapping of that service invocation. Otherwise, a new service invocation is added to the form's onMapping Event.
- Drag and drop Request parameter: If a service invocation already exists in the form, this mapping is appended to it. Otherwise, a new service invocation is added on a generated Button widget.
- Drag and drop the service onto your form.
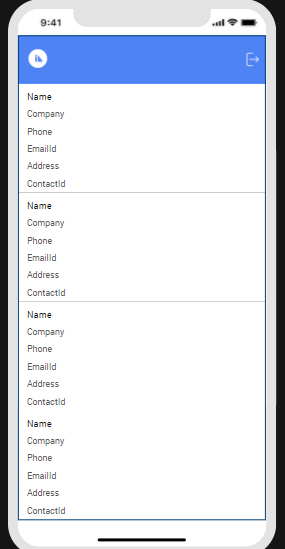
- Post this action, widgets are added to the form and the Integration service is associated with the form.
The selected Integration service appears under Project Services. You can expand any service to view its Request or Response parameters. The mapped parameters of any service appear in a bold and italics style to differentiate from unmapped parameters. Here, responseList appears in bold and italics format.
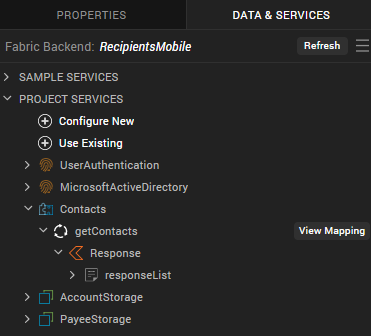
You can also click View Mapping to view the mapping details of the getContacts service in the Action Editor. The specific operation of the service is auto-highlighted in the Action Editor. Click Generate Code to view all the mappings of the getContacts operation.
Dragging and dropping operations onto the form leads to the auto-generation of UI elements.
Use a Sample Object Service
To use a sample Object service, do the following:
- In Quantum Visualizer, create a new project or open an existing one.
- Create a form; for example, frmSample.
- From the Data & Services panel, select Sample Services. The list of pre-configured services appears.
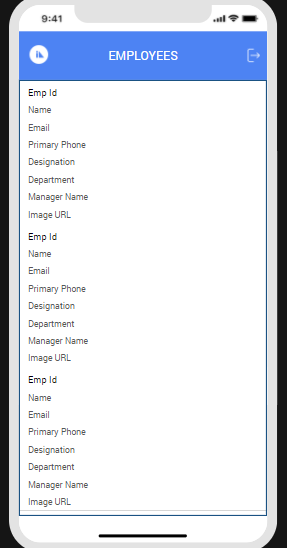
- Expand any Object service. Here, EmployeeDataObjects and ProductDataObjects are the sample Object services.
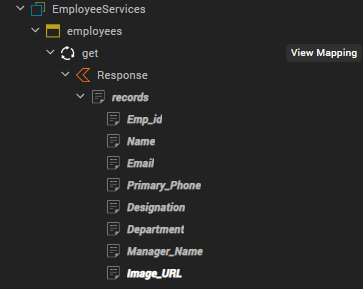
- Expand any Object service to view its available Request parameter. The respective responseList or requestList is auto-displayed. Here, Employee Services > employees > get > Response > records.
- You can perform any of the following actions:
- Drag and drop the service on to your form.
A dialog box appears asking you to generate either a List, or a Details, or an Entry form. You can select any of the three options as follows:List Using Response: If the response contains a collection, a Segment is added to the parent form. This Segment is mapped to the Response parameter of the service.
- Entry form for Request: A FlexScrollContainer containing TextBoxes and Labels is added. The TextBoxes are mapped to the Request parameters of the service.
NOTE: For the GET method in Object Services, the Entry form for Request option is disabled.
- Details Using Response: A FlexContainer containing Labels is added. These Labels are mapped to the Response parameters of the service.
- Alternatively, you can directly drag and drop either the Response or Request parameter of the service onto the form:
Drag and drop Response parameter: If a service invocation already exists in the form, this is added to the mapping of that service invocation. Otherwise, a new service invocation is added to the form's onMapping Event.
- Drag and drop Request parameter: If a service invocation already exists in the form, this mapping is appended to it. Otherwise, a new service invocation is added on a generated Button widget.
- Drag and drop the service on to your form.
- Post this action, widgets are added to the form and the Object service is associated with the form.
The selected Object service appears under Project Services. You can expand any service to view its Request or Response parameters. The mapped parameters of any service appear in a bold and italics style to differentiate from unmapped parameters.
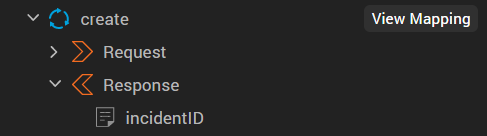
When you use the create method with primary key as incidentID, a Response parameter is automatically generated based on the run-time response of the app. under create > Response on the Data & Services panel.
You can also click View Mapping to view the mapping details of the get service in the Action Editor. The specific operation of the service is auto-highlighted in the Action Editor. Click Generate Code to view all the mappings of the get operation.
Dragging and dropping operations onto the form leads to the auto-generation of UI elements.
Create and Use New Services
This section explains how to create new services by using the Data & Services panel and how to use those services in your application.
From the Data Panel, you can set up new data sources (Quantum Fabric services) through a simplified view of Quantum Fabric console. You can view the associated services in your corresponding Quantum Fabric app.
Create an Identity Service
If your Identity service type is a basic one, the input parameters are username and password. Even for the OAuth password grant type of service, the parameters are username and password. For all other types of OAuth services, there are no input parameters. The SAML Identity service follows a similar pattern as the OAuth service.
You can view two types of operations for Identity services: login and logout. The SDK code is auto-generated for each operation. You can edit an Identity service by right-clicking on the service and then selecting the Edit option.
To create a new Identity service, do the following:
- In Quantum Visualizer, open your project.
- From the Data & Services panel, select Project Services from the list. The list of available services appears.
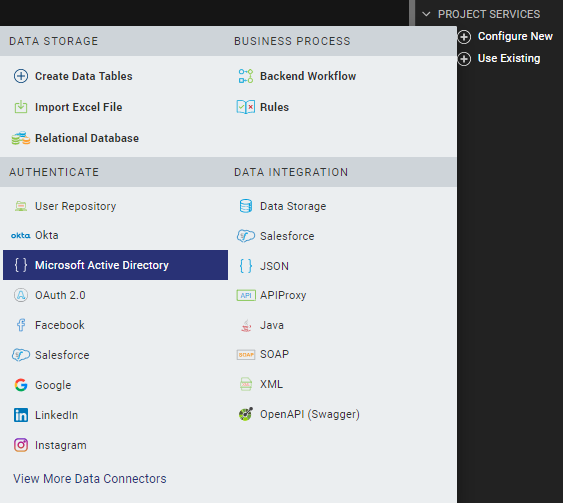
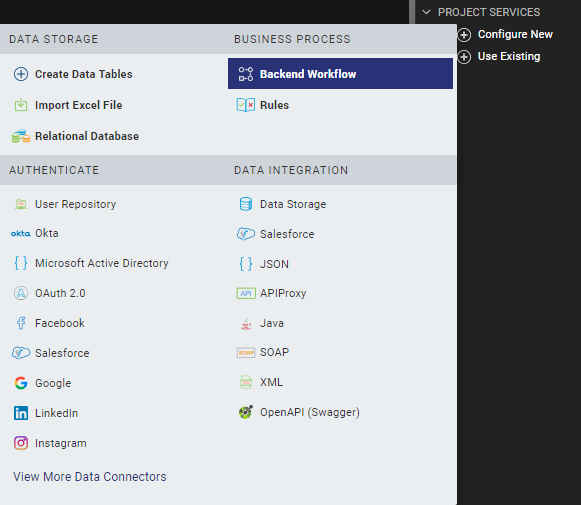
- Click Configure New. A list of services that you can configure appears.
- Under Authenticate, select an Identity service; in this case, Microsoft Active Directory.
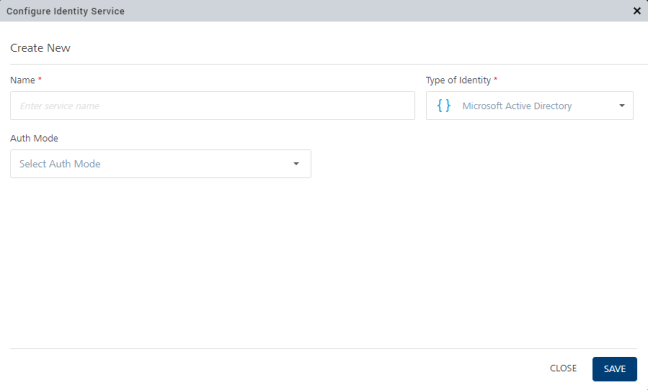
- The Configure Identity Service window appears, by using which you need to configure the Microsoft Active Directory service. Specify the details in the required fields, and then click Save. For more information on how to create an Identity service, click here.
- Once the service is created, it is displayed in the Project Services list. You can then directly drag and drop the service onto a form and start using it.
When you drag and drop an Identity service onto a form, various widgets are created automatically on the form based on the type of service: OAuth or Non-OAuth. For a Non-OAuth service, two text fields (username and password) and a button (Login) are generated. For an OAuth service, only a Login button is generated.
When you click the View button, the newly created form appears. The form’s pre-show invokes the Identity service and passes the reference of the Browser widget. You can modify the Browser widget, which you linked to the button, with a different Browser widget.
NOTE: The Data & Services panel supports all types of Identity providers such as Quantum user Store, Google, Salesforce, and Facebook.
NOTE: The reference of the device Browser widget is mandatory for Google OAuth 2.0 services. For this service, the deeplink URL is auto-generated by Quantum Visualizer.
Create an Integration Service
By default, you can view Integration services in the Data & Services panel. You can also set up new data sources. Once you configure the Integration service, you can view the request and response parameters.
To create a new Integration service, do the following:
- In Quantum Visualizer, open your project.
- From the Data & Services panel, expand Project Services.
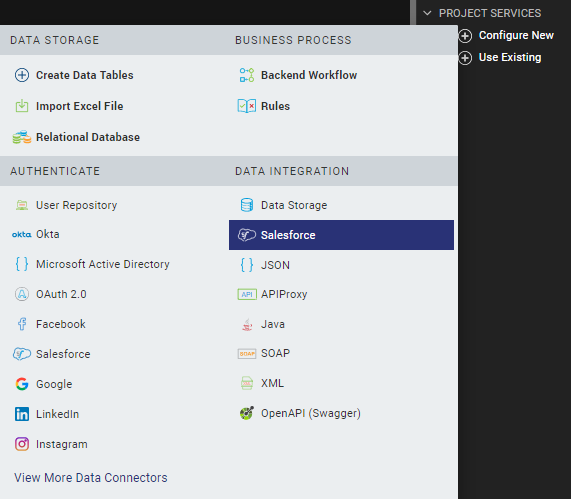
- Click Configure New to configure a new Integration service. A list of services that you can configure appears.
- Under Data Integration, select an Integration service; in this case, Salesforce.
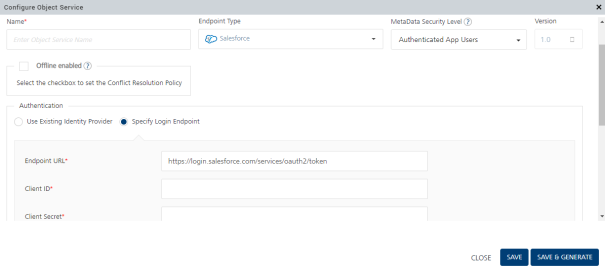
- The Configure Integration Service window appears, by using which you need to configure the Salesforce service. Specify the details in the required fields, and then click Save & Add Operation. For more information on how to create an Integration service, click here. In this case, the Salesforce Integration service.
- Once the service is created, it is displayed in the Project Services list. You can then directly drag and drop the service onto a form and start using it.
Create an Object Service
You can view Object services in the Data & Services panel. You can also set up new data sources. Once you configure an Object service, you can view the request and response parameters.
To create a new Object service, follow these steps:
- In Quantum Visualizer, open your project.
- From the Data & Services panel, expand Project Services.
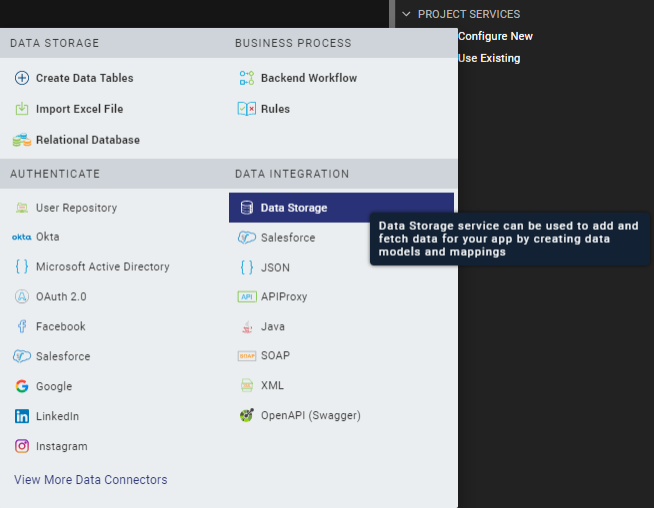
- Click Configure New. A list of services that you can add appears.
- Under the Data Integration section, select an Object service. Here, Data Storage is the Object service.
NOTE: From Quantum Visualizer V9, the Data Storage Object service is available under the Data Integration section in the list of services.
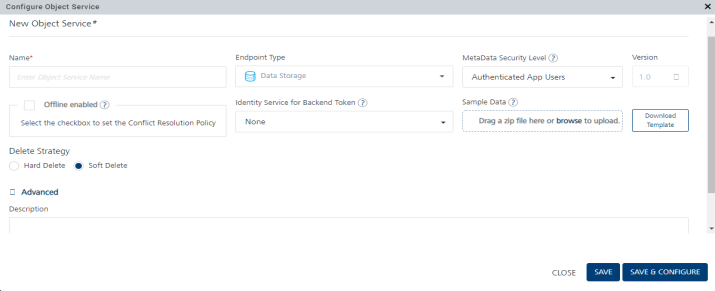
- The Configure Object Service window appears, with Endpoint Type selected as Storage by default. You must type the Name of the Data Storage Object service and also specify other details in the necessary fields. Then either click Save & Configure to configure the object data model or click Save to just save the new service. For more information on how to create an Object service, click here.
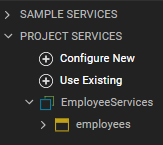
- After the service is created, it is displayed under Project Services > Objects. You can then directly drag and drop the service onto a form and start using it.
Create a Backend Workflow Service
You can view Backend Workflow services in the Data & Services panel. Using Workflow, you can visualize and design a backend process by simply dragging and dropping different types of nodes and connecting them as per the logic you need.
To create a new Backend Workflow service, do the following:
- In Quantum Visualizer, open your project.
- From the Data & Services panel, expand Project Services.
- Click Configure New to configure a new Backend Workflow.
A list of services that you can configure appears. - Under Business Process, select Backend Workflow.
- In the Name field, type a unique name for the Backend Workflow service.
- From the Linked Object list, select the object to which you want to link the new Workflow service. You can either select an existing Object service or Create a new Object service.
- From the Nodes pane, drag and drop the required nodes onto the canvas to create a process.
For more information on how to create a Backend Workflow service, click here. - Click Save. The service is created and appears in the Project Services list. The Workflow service invokes when you drag and drop the associated Object service onto a form and start using it.
The Configure Workflow Service window appears.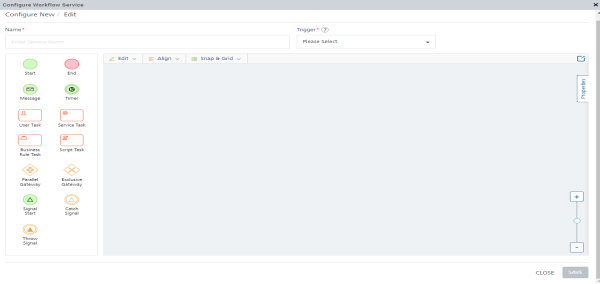
Create a Rules Service
You can view a Rules services in the Data & Services panel. Using Rules, you can define and store your business logic as a set of rules, or a collection of rules stored as a Ruleset.
To create a new Rules service, do the following:
- In Quantum Visualizer, open your project.
- From the Data & Services panel, expand Project Services.
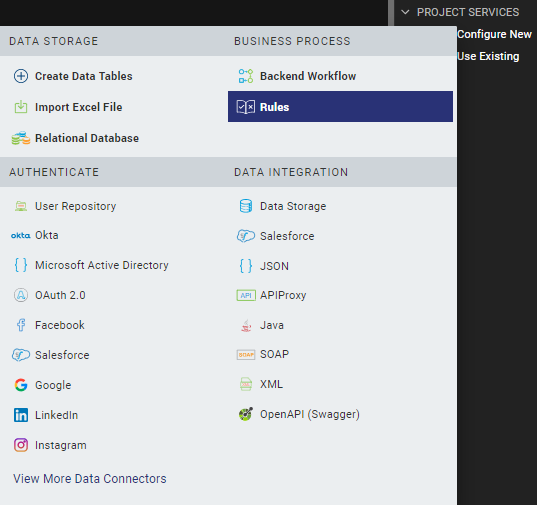
- Click Configure New.
A list of services that you can configure appears. - Under Business Process, select Rules.
- In the Name field, type a unique name for the Rules service, and also specify other details in the necessary fields.
For more information on how to create a Rules service, click here. - Click Save & Add Rule to configure the Ruleset, or click Save to just save the new service.
After the service is created, it is displayed under Project Services > Rules.
The Configure Rules Service window appears.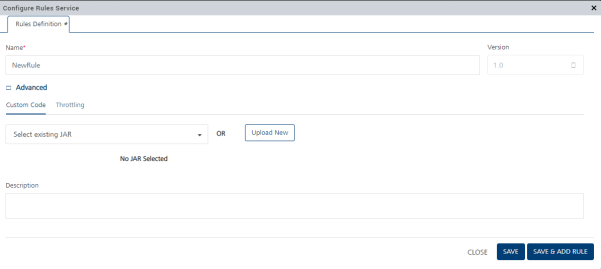
Use Existing Services
This section explains how to use and configure existing Identity, Integration, and Object services in your application by using the Data & Services panel.
From the Data & Services panel, configure existing sample services through a simplified view of Quantum Fabric console. You can view the associated services in your corresponding Quantum Fabric app.
To select and use an existing Identity/Integration/Object service, do the following:
- In Quantum Visualizer, create or open your project.
- From the Data & Services panel, select Project Services from the list. The list of available services appears.
-
Click Use Existing. A list of options appears.
- Select either Identity, Integration, or Objects, and then sign in to your Quantum account to use the required service available in your Quantum Fabric instance:
- For Identity service: The Select Identity Service(s) window appears.
Choose the required Identity service; if no service is available in your Quantum Fabric Console, you need to configure one. Specify the details in the required fields, and then click Save. For more information on how to create an Identity service, click here. - For Integration service: The Select Integration Service(s) window appears.
Choose the required Integration service; if no service is available in your Quantum Fabric Console, you need to configure one. Specify the details in the required fields, and then click Save & Add Operation. For more information on how to create an Integration service, click here. In this case, the Salesforce Integration service.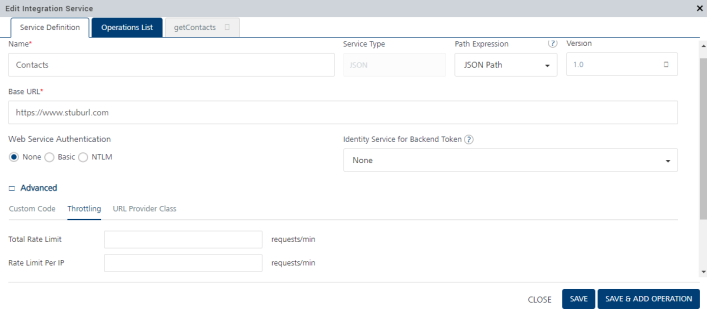
- For Object service: The Select Object Service(s) window appears.
Choose the required Object service; if no service is available in your Quantum Fabric Console, you need to configure one. Specify the details in the required fields, and then click Save & Generate. For more information on how to create an Object service, click here.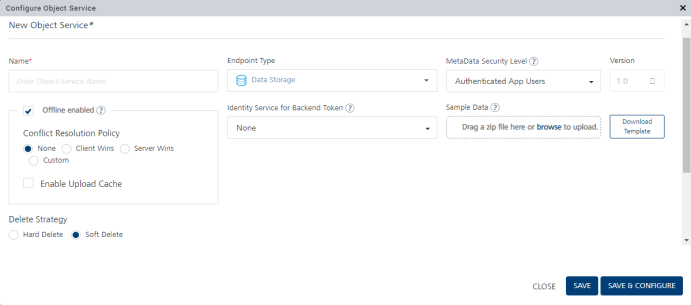
- For Identity service: The Select Identity Service(s) window appears.
- Once the service is created, it is displayed in the Project Services list. You can then directly drag and drop the service onto a form and start using it.
Use Project Services
This section provides information on how to discover and use a Project service from the Data & Services panel.
Use an Identity Project Service
To use an Identity Project service, do the following:
- In Quantum Visualizer, open your project.
- Create a form; for example, frmSample.
- On frmSample, add button widgets to which you want to add the service.
- From the Data & Services panel, expand Project Services.
- Click Use Existing.
A list of available services appears. - Click Identity Service.
The Select Identity Service dialog box appears. - Select the required service from the list of available services, and then click Add.
The service appears in the Data & Services panel. - Expand the service that you want to use and view the requests/responses of the service.
- Drag and drop appropriate services on to the buttons. The Identity service is associated with the form.
Use an Integration Project Service
To use an Integration Project service, do the following:
- In Quantum Visualizer, open your project.
- From the Data & Services panel, expand Project Services.
- Click Use Existing.
A list of available services appears. - Click Integration Service.
The Select Integration Service dialog box appears. - Select the required service from the list of available services, and then click Add.
The service appears in the Data & Services panel. - Expand the service that you want to use and view the requests/responses of the service.
- Drag and drop the service onto your form. The service is associated with the form.
Use an Object Project Service
To use an Object Project service, do the following:
- In Quantum Visualizer, open your project.
- From the Data & Services panel, expand Project Services.
- Click Use Existing.
A list of available services appears. - Click Object Service.
The Select Object Service dialog box appears. - Select the required service from the list of available services, and then click Add.
The service appears in the Data & Services panel. - Expand the service that you want to use and view the requests/responses of the service method.
- Drag and drop the service onto your form. The service is associated with the form.
Use a Backend Workflow
To use a Backend Workflow service, do the following:
- In Quantum Visualizer, open your project.
- From the Data & Services panel, expand Project Services.
- Click Use Existing.
A list of available services appears. - Click Backend Workflow.
The Select Workflow Service dialog box appears. - Select the required service from the list of available services, and then click Add.
The service appears in the Data & Services panel. - Expand the Object service that you associated with the Backend Workflow, and view the requests/responses of the service method.
- Drag and drop the Object service onto your form. The service and the Workflow associated with the service are associated with the form.
Use a Rules Service
To use a Rules service, do the following:
- In Quantum Visualizer, open your project.
- From the Data & Services panel, expand Project Services.
- Click Use Existing.
A list of available services appears. - Click Rules Service.
The Select Rules Service dialog box appears. - Select the required service from the list of available services, and then click Add.
The service appears in the Data & Services panel.
Disable the Categorization of Project Services
From Quantum Visualizer V9, the service categories are displayed under Project Services only when a service is linked from the Data & Services panel. In addition, an option to disable/enable the categorization of linked services under Project Services has been provided in the Visualizer Preferences window.
To disable/enable the categorization of linked services under Project Services, follow these steps:
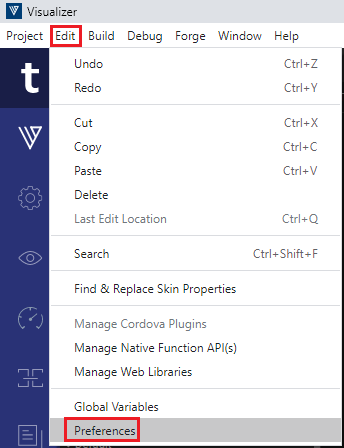
- In Quantum Visualizer, click Edit > Preferences. The Visualizer Preferences window appears.
- Click the Quantum Fabric tab.
- Under the Data & Services Panel section, the Group project services into categories check box is selected by default.
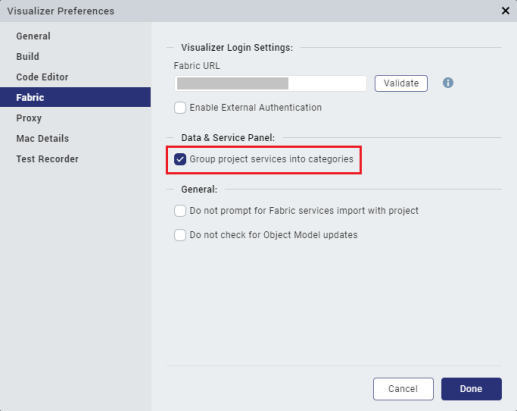
- To disable the categorization of linked services under Project Services, clear the Group project services into categories check box.
- Click Done. The linked services under Data & Services panel > Project Services do not appear in the categories of either Identity, Integration, or Object services.
NOTE: To enable the categorization of linked services under Project Services again, go to Edit > Preferences > Quantum Fabric tab and select the Group project services into categories check box. The linked services under Data & Services panel > Project Services appear in the categories of either Identity, Integration, or Object services respectively.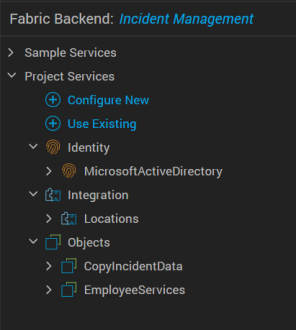
Edit a Service
You can edit a service that is added to your project by right-clicking the service and selecting Edit.
To edit a service, do the following:
- In Quantum Visualizer, open your project.
- From the Data & Services panel, expand Project Services. The list of available services appears.
- Right-click the service that you want to edit. A list of options appears.
- Select Edit. The service opens in Quantum Fabric. Here, while editing an Identity service, the Configure Identity Service window appears.

- Make the required changes, and then click Save & Add Operation. The selected service is updated with your changes.
Unlink a Service
You can unlink a service from your project by right-clicking the service and selecting Unlink.
To unlink a service, follow these steps:
- In Quantum Visualizer, open your project.
- From the Data & Services panel, expand Project Services. The list of available services appears.
- Right-click the service that you want to unlink. A list of options appears.
- Select Unlink. The Confirm Service Unlinking window appears. This window provides details on the operations and their respective action sequences that will be unlinked for that service, and asks for your confirmation whether you want to unlink the service.
- Click Ok. The service is removed from the Project Services list.
Object Service-related Features
You can use the Data & Services panel to perform the following actions related to Object Services:
- Generate Object Services UI for Responsive Web
- Generate CRUD Forms for an Object Service
- Create a Data Table for an Object Service
- Configure an Object Data Model by Importing an Excel File
- Customize the Generation of Data Model Objects
Generate Object Services UI for Responsive Web
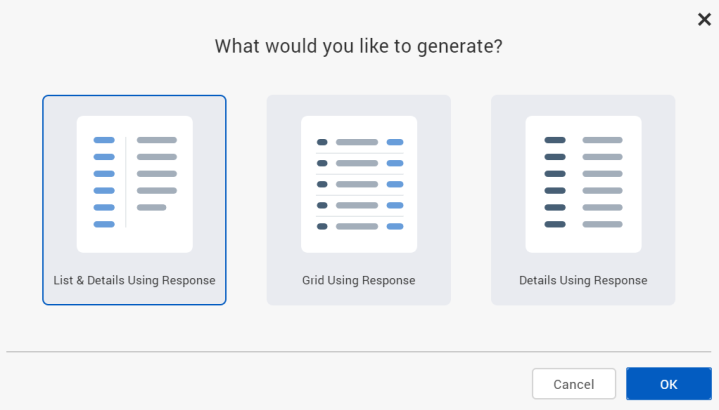
From Quantum Visualizer V9, when you drag and drop service operations from the Data & Services panel onto Responsive Web forms, the following types of forms can be generated:
- List and Details Using Response (for Get operations)
- Grid Using Response (for Get operations)
- Details Using Response (for Get operations)
- Entry (for Create and Update operations)
To understand this feature in detail, let us consider a scenario where Steve (a low-code developer) wants to create an app called Incident Management. He has already created the associated Quantum Fabric app, and now wants to configure the app's UI.
The Admin of an airport can use the Incident Management Responsive Web app to view, create, update, and assign incidents/tasks to relevant staff members. In addition, staff members can use the Incident Management Mobile app to view and act upon their assigned tasks as well as to create new tasks.
The Responsive Web and Mobile apps comprise of four forms: list, detail, update, and create.
NOTE: When you drag service operations from the Data & Services panel and drop onto Responsive Web forms, auto-generated fields such as CreatedBy, LastUpdatedBy, CreatedDateTime, LastUpdatedDateTime, and SoftDeleteFlag are not added to the forms by default. To add any of these fields to a Responsive Web form, drag the required operation parameter (for example, CreatedDateTime) from the Data & Services panel and drop onto the form. This feature is only applicable for Storage services.
In case of other types of services, the Data & Services panel does not auto-generate the SoftDeleteFlag and other object tracking fields. You must create a custom field on Quantum Fabric, and use the field for tracking purposes.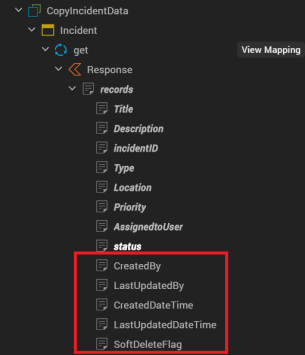
List and Details Using Response Form
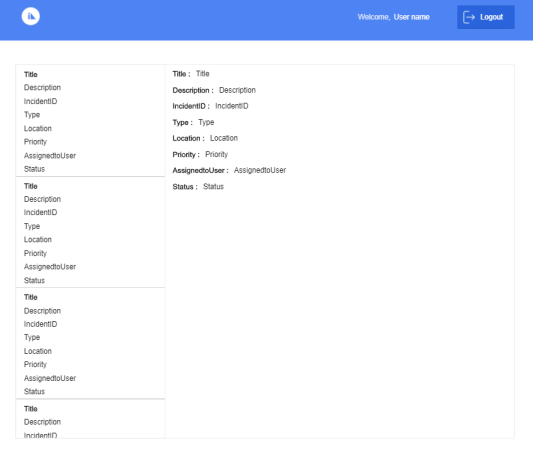
When you drag and drop the Get operation in an Object service onto a Responsive Web form and select the List and Details Using Response option, this type of form is generated on the Project Canvas. A list and details form consists of a list of items and if a user selects a specific item, the details of that item are displayed on the right of the screen.
Grid Using Response Form
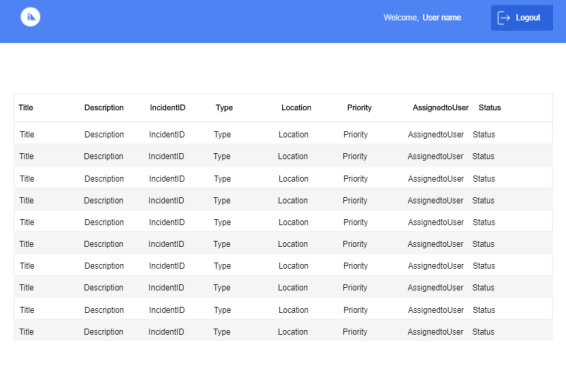
When you drag and drop the Get operation in an Object service onto a Responsive Web form and select the Grid Using Response option, this type of form is generated on the Project Canvas. A grid form is a tabular representation of list items. Users can select any row grid item, and they are navigated to the details screen of that item.
Details Using Response Form
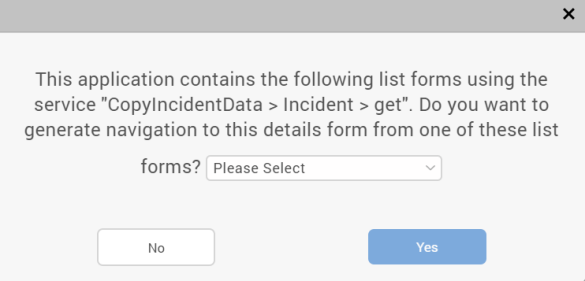
When you drag and drop the Get operation in an Object service onto a Responsive Web form and select the Details Using Response option, a dialog box appears. If a Responsive Web list form already exists, the dialog box asks if you want to generate navigation from the link to the details form. Click Yes to generate a navigation link between the list and detail forms; otherwise, click No.
NOTE: If multiple Responsive Web list forms are present, then you will need to choose one list form to create the navigation link.
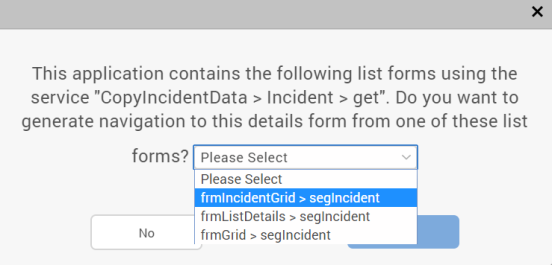
A details form is then generated on the Project Canvas. The details form contains additional information of a list item. If you create the navigation link between the list and detail forms, users are taken to the detail form when they select a specific list item.
Entry Form
When you drag and drop either the Create or Update operation in an Object service onto a Responsive Web form, an Entry form is automatically generated on the Project Canvas.
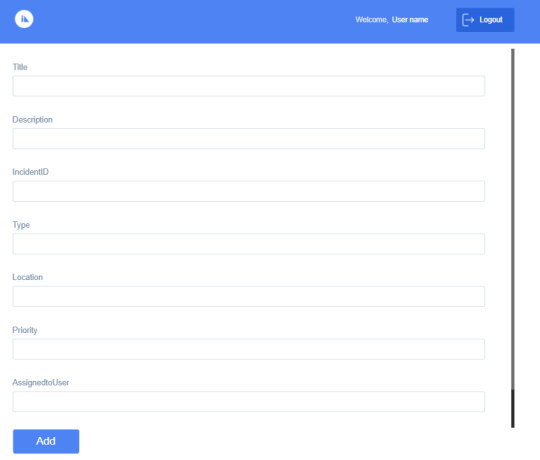
Create Operation
When an entry form is added for a Create operation, users can specify the required details to create new list items. The following image illustrates the Create Incident screen of the Incident Management app. App users can leverage this screen to create new incident items and assign them to relevant people.
Update Operation
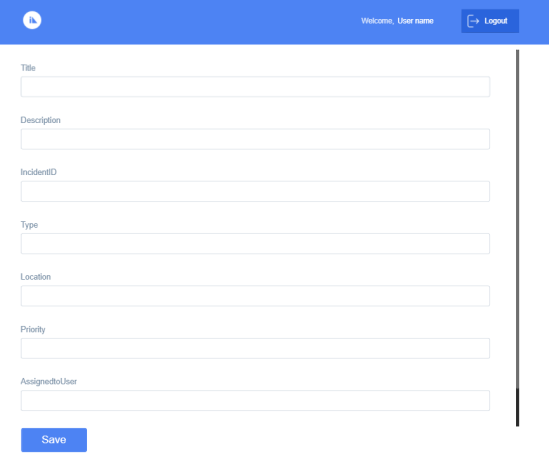
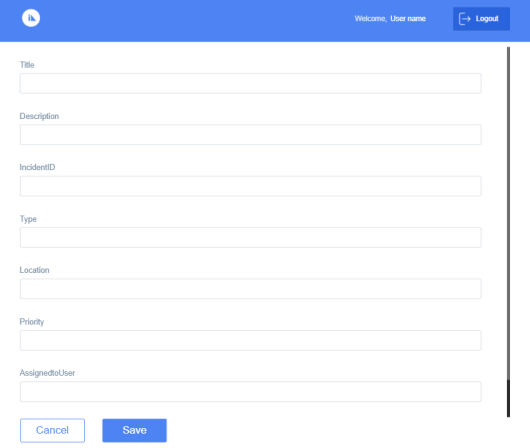
When an entry form is added for an Update operation, users can make the required modifications to existing list items. The update method automatically fetches the values of the selected record and pre-fills the details in the respective fields.
The following image illustrates the Update Incident screen of the Incident Management app.
Generate CRUD Forms for an Object Service
From Quantum Visualizer V9, you can generate CRUD forms and associated form-navigation links for an Object service. If you have configured the data model for an Object service or linked your Quantum Visualizer project to a Quantum Fabric app with a defined Object service data model, you can leverage this feature. This enhancement is applicable for Object services on Mobile, Tablet, and Responsive Web (Desktop) channels.
You can generate CRUD forms at method-level, object-level, and at service-level.
NOTE: When you use the generate forms feature, auto-generated fields such as CreatedBy, LastUpdatedBy, CreatedDateTime, LastUpdatedDateTime, and SoftDeleteFlag are not added to the CRUD forms by default. To add any of these fields to a form, drag the required operation parameter from the Data & Services Panel and drop onto the form. This feature is only applicable for Storage services.
In case of other types of services, the Data & Services panel does not auto-generate the SoftDeleteFlag and other object tracking fields. You must create a custom field on Quantum Fabric, and use the field for tracking purposes.
NOTE: When you drag and drop a method, object, or service from the Data & Services panel to anywhere on the Storyboard view canvas, the relevant forms and associated hard navigation links between the forms are automatically generated.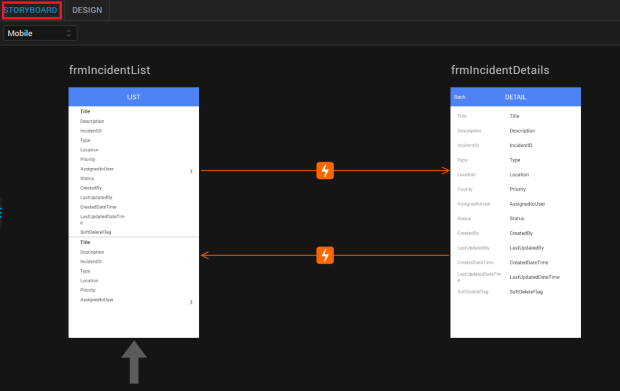
NOTE: From Quantum Visualizer V9 SP2, when you select a Generated Form in the Data and Services panel at the Service-level, forms ignore the child objects.
To generate CRUD forms for an Object service for Responsive Web (Desktop) channel, follow these steps:
- In Quantum Visualizer, configure the data model for a new or existing Object service. Alternatively, link your Quantum Visualizer project to a Quantum Fabric app with a defined Object service data model.
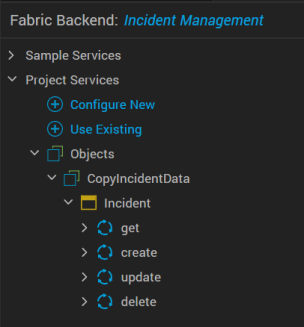
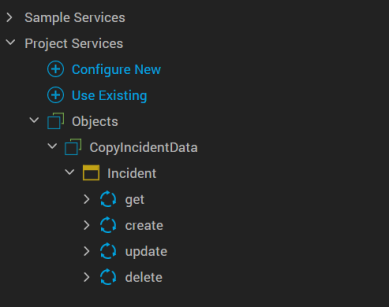
In this procedure, we will discuss the example of the Object service of the Incident Management app. - Go to Data & Services > Project Services.
- Expand Objects > CopyIncidentData > Incident.
- You can generate CRUD forms for any of the following items:
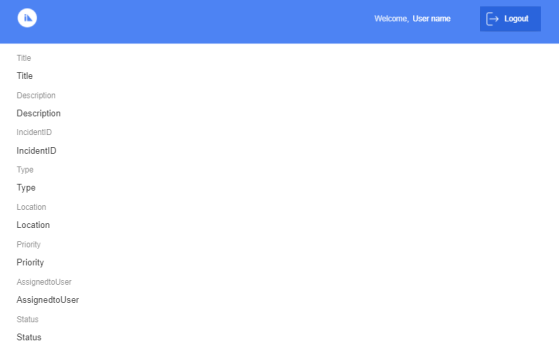
- Method-level: Right-click any method; for example, get. Select Generate Forms > Desktop. Two types of forms (Grid and Details) are generated with the respective navigation links between each other. An appropriate breadcrumb link is also displayed at the top of the Details form. Users can click the breadcrumb link to go back to the Grid screen of the app.
Grid Form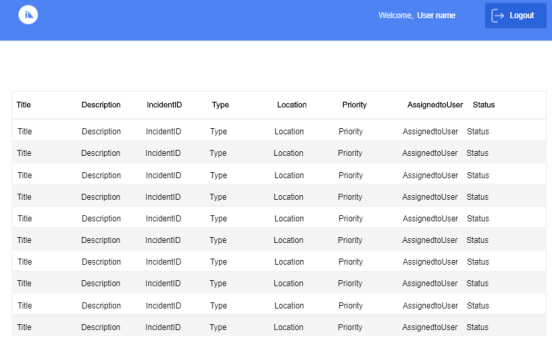
Details Form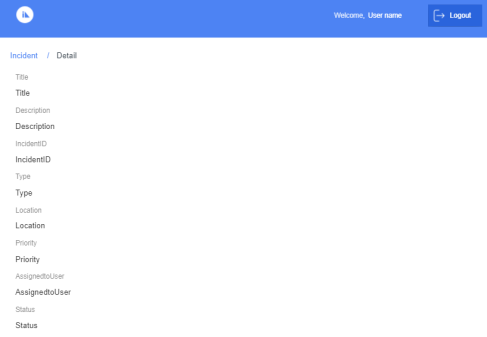
If you perform the Generate Forms action for the create or update methods, only the Create/Update entry form is generated.
- Object-level: Right-click Incident, and then select Generate Forms > Desktop. Four types of forms (Grid, Details, Create entry form, and Update entry form) are generated with the respective navigation links among each other. An appropriate breadcrumb link is also displayed at the top of the Details, Create, and Update forms. Users can click the breadcrumb link to go back to the Grid screen of the app.
Grid Form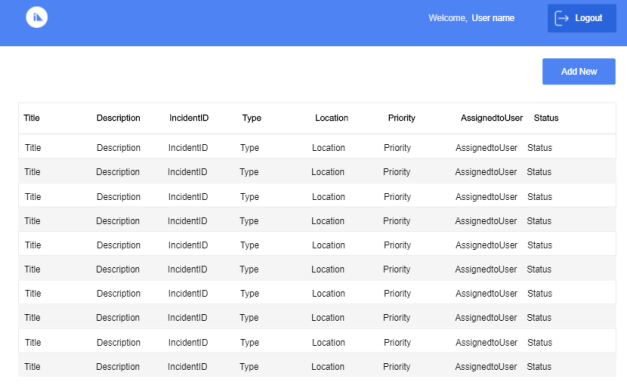
Details Form
Create Form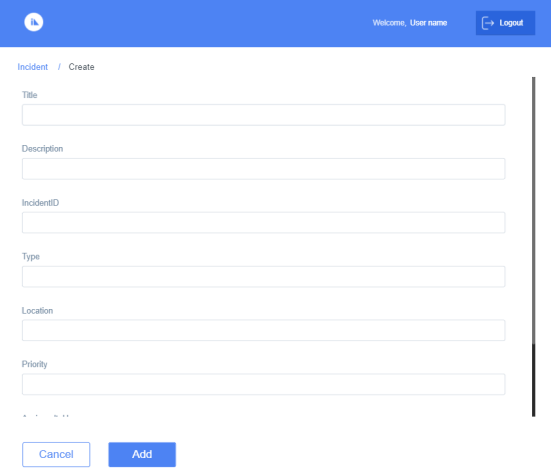
Update Form
- The Object service: Right-click CopyIncidentData, and then select Generate Forms > Desktop. Five types of forms (Dashboard form, Grid, Details, Create entry form, and Update entry form) for each object in the Object service are generated, with the respective navigation links among each other.
The Dashboard form displays all the objects that are part of the selected Object service. From the Dashboard screen, app users can navigate to the respective Grid, Details, Create, and Update forms of the objects. If you have not defined the startup form of the app, the Dashboard form is made the startup form by default.
An appropriate breadcrumb link is also displayed at the top of the Grid, Details, Create, and Update forms. Users can click the breadcrumb link to go back to either the Dashboard screen or Grid form of the app, as appropriate.
Dashboard Form (with Incident object)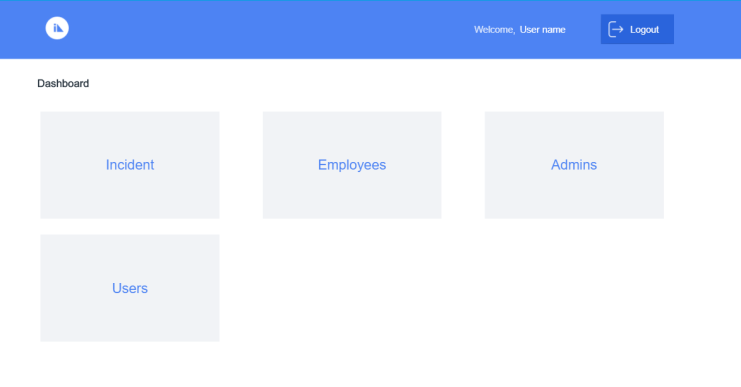
Grid Form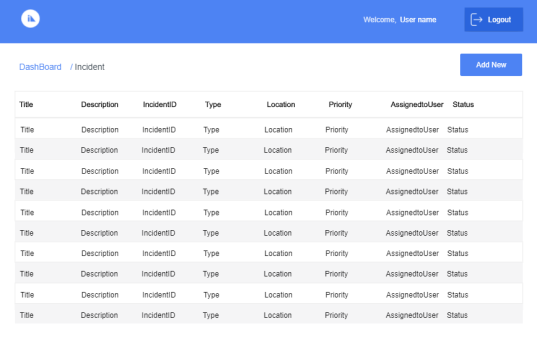
Details Form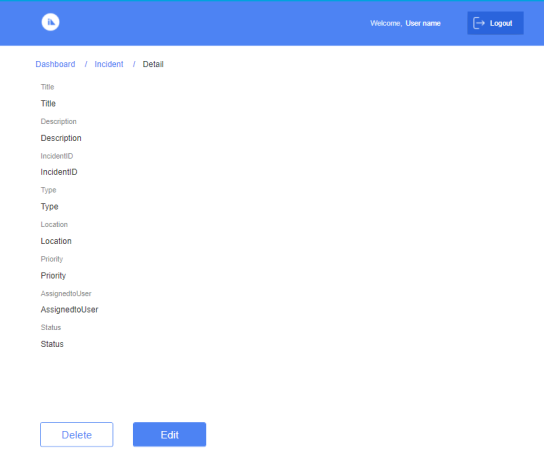
Create Form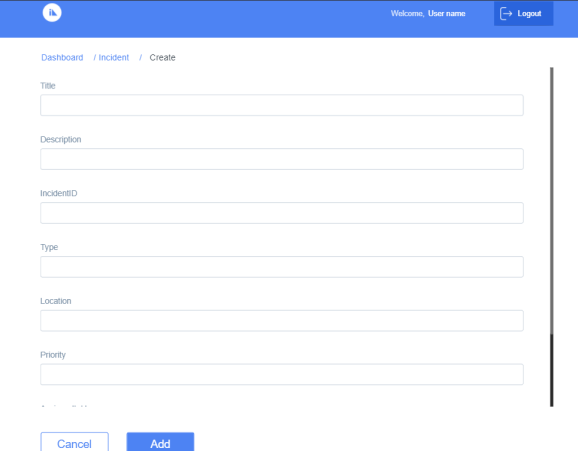
Update Form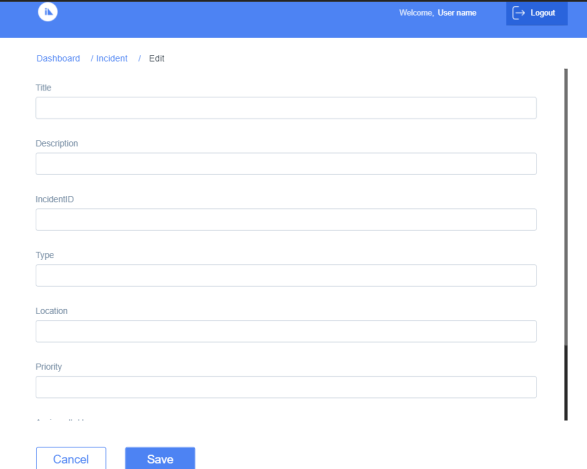
NOTE: If an Object service contains multiple data model objects, then all available forms and navigation links for each data model object are generated.
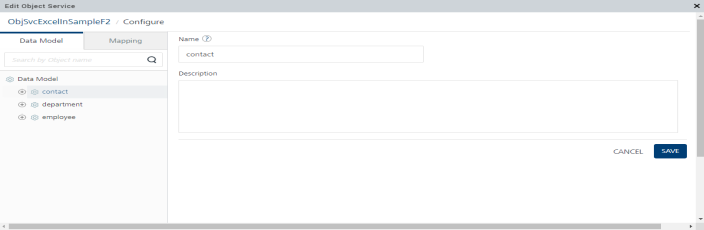
For example, in the following image, the excelInOrderManagement Object service contains three data model objects: contact, department, and employee. So if you try to generate CRUD forms for the excelInOrderManagement Object service, all available forms and associated navigation links are generated for the contact, department, and employee data model objects.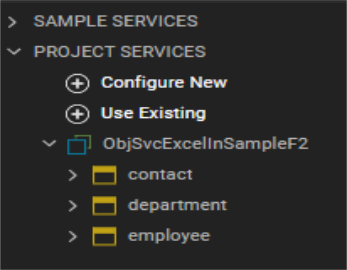
- Method-level: Right-click any method; for example, get. Select Generate Forms > Desktop. Two types of forms (Grid and Details) are generated with the respective navigation links between each other. An appropriate breadcrumb link is also displayed at the top of the Details form. Users can click the breadcrumb link to go back to the Grid screen of the app.
Create a Data Table for an Object Service
From Quantum Visualizer V9, you can create a data table for an Object service. Several details such as data type, Primary key, nullable, and maximum length can also be specified for the fields of the Object Service.
NOTE: You can create a data table for either an existing Quantum Fabric app or for a new one.
To create a data table for an Object service from within Quantum Visualizer, follow these steps:
-
In Quantum Visualizer, open your project.
- On the Data & Services panel, expand Project Services.
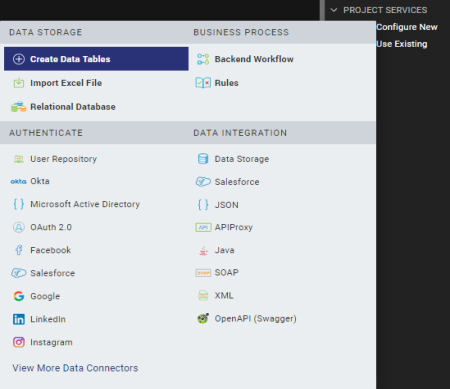
- Click Configure New. A list of services appears.
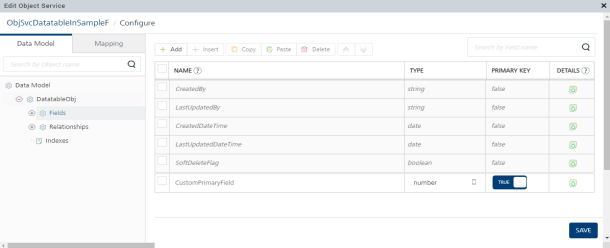
- Under the Data Storage section, click Create Data Tables. The Edit Object Service > Data Model > Fields window appears. A new Object is created in which you can quickly configure object fields. By default, every Object contains some system-generated fields.
- Click Add. A new field is created in the fields definition table.
- Under the Name column, type the required name of the field. Here, Version is the field name.
- Under the Type column, select the data type of the field. The available data types include string, date, boolean, number, binary, and enum. The string data type is selected by default.
NOTE: The Enumeration (enum) data type enables you to add a maximum of 50 comma-separated options as valid values in a field. For example, a field called Priority can have enumeration values such as Critical, High, Medium, Low and a field called Gender can have valid values such as Male, Female, Other. The enum data type is rendered as a drop-down list containing only those valid values that you defined, and users can choose only one option at a time for that field. This data type is available from Quantum Visualizer V9. For more information on how to configure the enum data type, click here.
- If you want to set the field as a Primary Key, select Primary Key as True. The Primary Key value is False by default.
- Click Save, and then close the Edit Object Service window. The data table and new data table objects are created, and are displayed under Project Services > Objects as shown here.
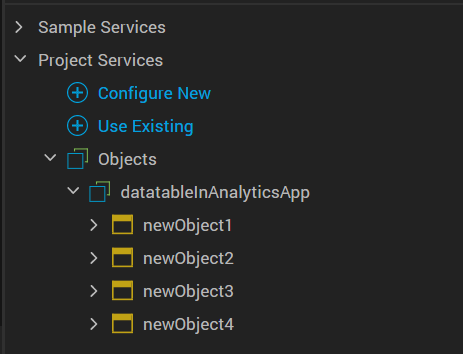
NOTE: You can create multiple objects in the data table of an Object service by following this procedure. These objects are then displayed as newObject<X> under Project Services on the Data & Services panel.
Configure an Object Data Model by Importing an Excel File
From Quantum Visualizer V9, you can create an object data model for an Object service by importing a locally-stored Microsoft Excel file. With this feature, low-code developers have an easy and faster way to import an object data model from a locally-stored Excel file.
NOTE: You can import an Excel file for either an existing Quantum Fabric app or for a new one.
To create an object data model by importing an Excel file for an Object Service from within Quantum Visualizer, follow these steps:
-
In Quantum Visualizer, open your project.
- On the Data & Services panel, expand Project Services.
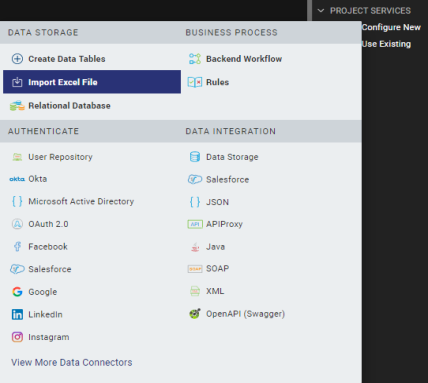
- Click Configure New. A list of services appears.
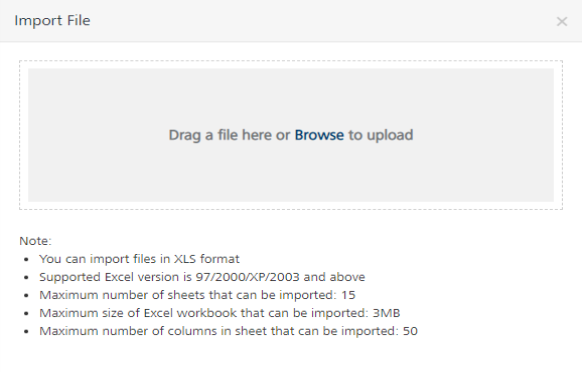
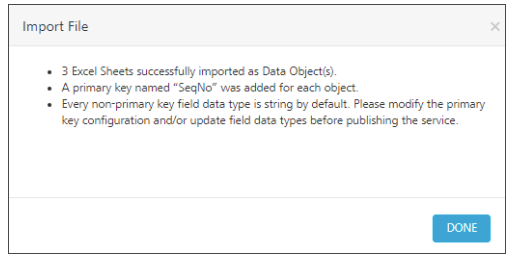
- Under the Data Storage section, click Import Excel File. The Import File window appears.
- You can perform any one of the following actions:
- Directly drag and drop the Excel file.
- Click Browse to search for, and then select the Excel file from your local system.
- After the Excel file has been successfully uploaded, a confirmation message appears. Click Next.
If you want to delete the uploaded file and import a different Excel file instead, click the Delete icon.
icon.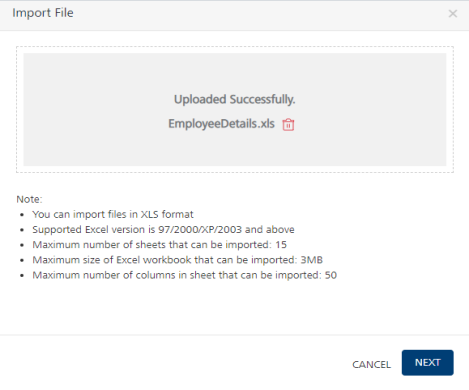
- The uploaded Excel Sheet is selected by default. In the Data Model Object Name box, type the required name of the data model. If there are multiple sheets in the Excel file, you can add the name of each sheet.
You can add the underscore (_) symbol in the data model object name. However, you cannot include any spaces or special characters in the data model object name.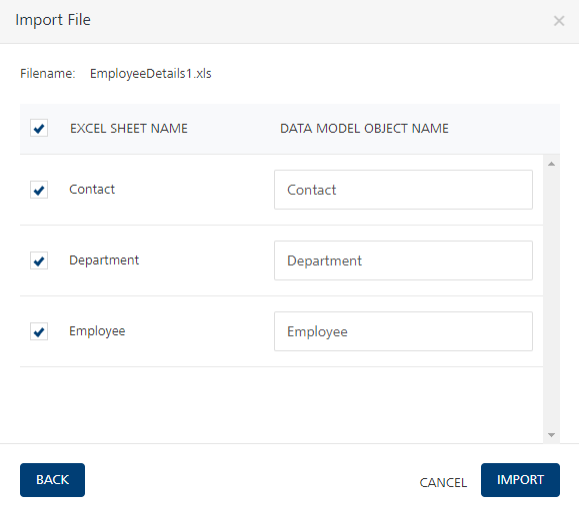
- Click Import. After the Excel sheet has been successfully imported, a window with a confirmation message appears. Click Done.
- The Edit Object Service window for the respective Quantum Fabric app appears. You can use this window to configure various items of the Object service data model, such as the Name, Description, Fields, Relationships, Indexes, and Primary Keys. For more information on how to configure the data model of an Object Service, refer the Configuring a Data Model topic in the Quantum Fabric User Guide.
- After you have configured the Object service data model, click Save and then close the Edit Object Service window. The object data model is created, and is displayed under Project Services > Objects.
Customize the Generation of Data Model Objects
From Quantum Visualizer V9, you can configure the generation of data model objects while designing your app. This enhancement enables you to select, reorder, and customize various properties of all the fields that you want to be displayed on the required screen of your app.
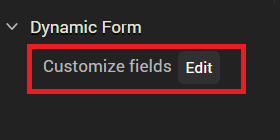
IMPORTANT: To dynamically configure the fields of the object model, you must click the parent container of the request/response parameter on the form. Then go to Properties panel > Look tab > Dynamic Form section, and click Edit beside Customize fields.
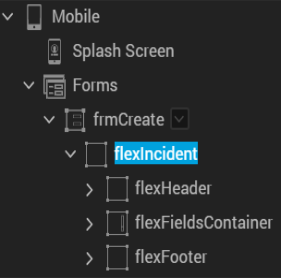
In the following image, flexIncident is the parent container of the service parameter on the frmStartUp form. Only while the parent container is selected, the Dynamic Form section appears under Properties panel > Look tab.
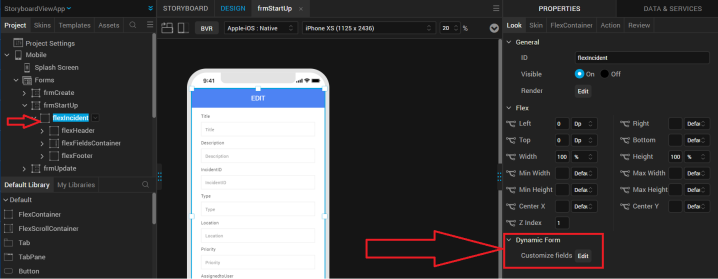
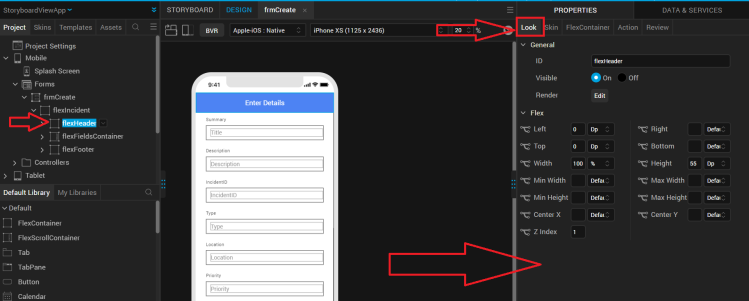
IMPORTANT: If you do not click the parent container of the request/response parameter on the form, the Dynamic Form section does not appear under Properties panel > Look tab. While any child container of the service parameter or the form itself is selected, the Dynamic Form section does not appear.
In the following image, flexHeader is a child container of the service parameter on the frmStartUp form. While this child container is selected, the Dynamic Form section does not appear under Properties panel > Look tab.
NOTE: From the Quantum Visualizer V9 Service Pack 3 release, if the data models of the Object Service are not up-to-date, an Update Object Models message appears in a dialog box above the data panel. The dialog box disappears after a few seconds if you do not perform any action (or do not dismiss the dialog box). However, the Update Object Models dialog box is stored as a notification in the Notifications section.
To understand this feature in detail, let us consider a scenario where Steve (a low-code developer) wants to create an app called Incident Management. He has already created the associated Quantum Fabric app, and now wants to configure the app's UI.
The Admin of an airport can use the Incident Management Responsive Web app to view, create, update, and assign incidents/tasks to relevant staff members. In addition, staff members can use the Incident Management Mobile app to view and act upon their assigned tasks as well as to create new tasks.
The Responsive Web and Mobile apps comprise of four forms: list, detail, update, and create.
This topic consists of the following sections:
Prerequisites
- Create a Quantum Fabric app.
- Link the Quantum Fabric app to your Quantum Visualizer project.
Configure Dynamic UI Properties
In this section, we will configure the dynamic properties of the fields on the Create Incident Entry screen of the Incident Management Mobile app:
- In your Quantum Visualizer project, go to Project Explorer > Mobile > Forms, and then create a new form called frmCreate.
- Go to the Data & Services panel > Project Services > Objects > CopyIncidentData > Incident.
- Drag and drop the create method onto the Project Canvas. The entry form is generated.
- On the Project Explorer, under frmCreate, click flexIncident. Here, flexIncident is the parent container of the create Request parameter.
- Go to Properties panel > Look tab > Dynamic Form, and then click Edit beside Customize fields. The Configure Entry Form window appears.
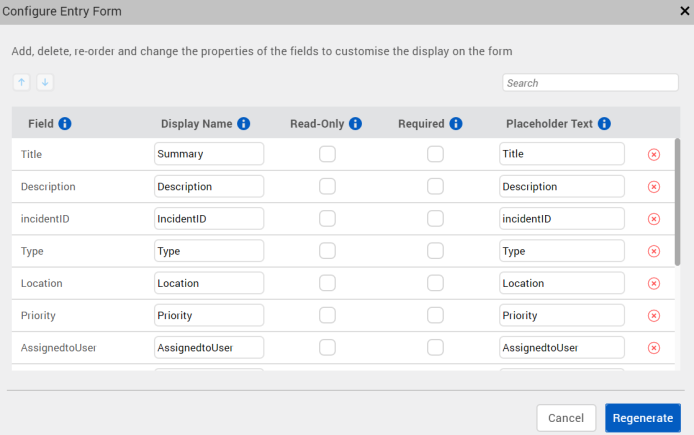
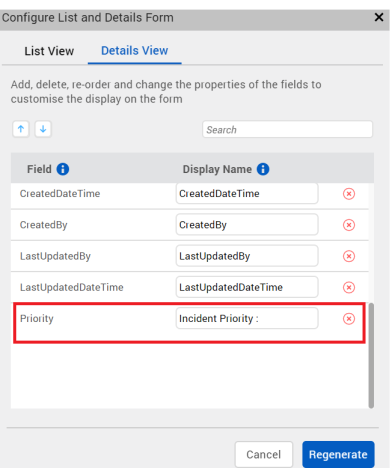
You can use the Configure Entry Form window to configure the dynamic properties of the fields. In this procedure, we will discuss the following operations that can be performed on a field called Priority on the frmCreate form:
- Reorder a Field: In the Configure Entry Form window, click the Priority field. Keep clicking the Move Up icon
 until the Priority field is at the top of the list as shown.
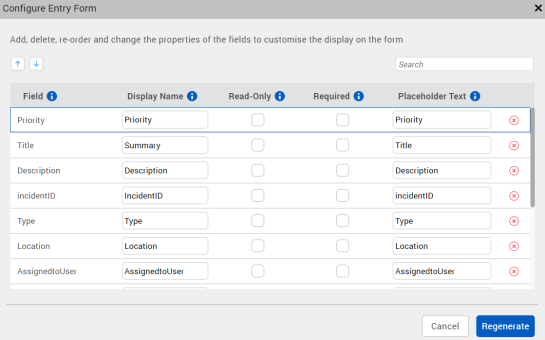
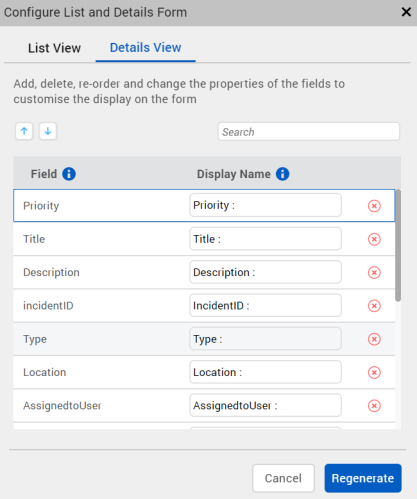
In List Using Details Forms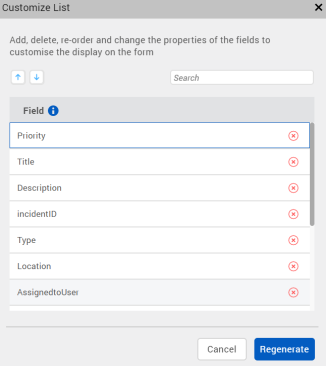
In Details Using Response Forms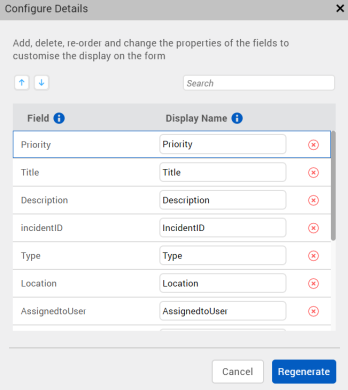
In List and Details Forms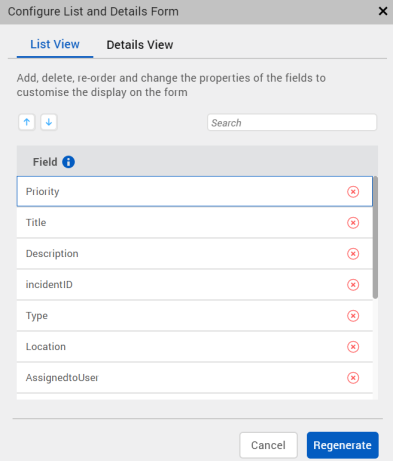
In Grid Forms
NOTE: If you want to move a field down the order, select the field and click the Move Down icon  as many times as necessary.
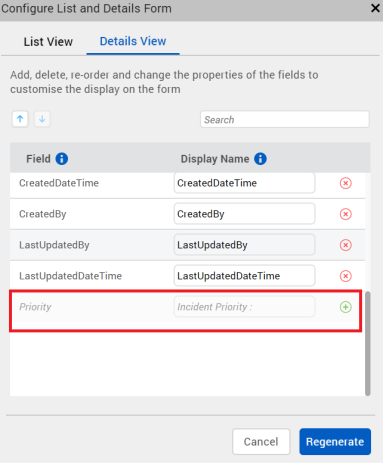
- Add/Modify the Display Name and Placeholder Text: In the Configure Entry Form window, for the Priority field, type the Display Name as Incident Priority. Similarly, type the Placeholder Text as Incident Priority as shown.
Display Name signifies the name of the field that is displayed on the screen. And Placeholder Text enables you to provide a help text about the field.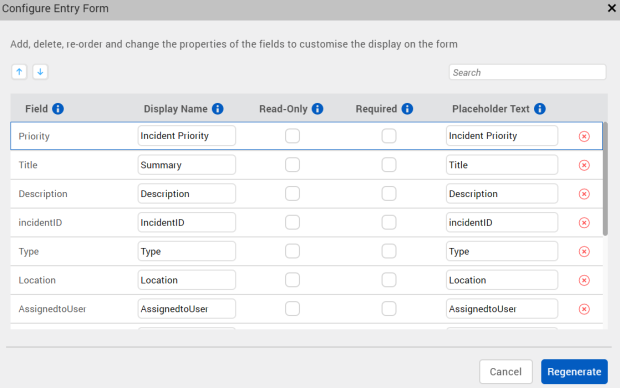
In Details Using Response Forms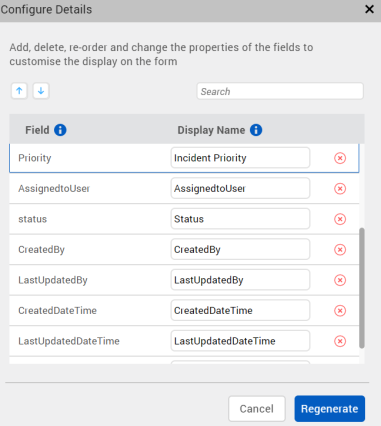
In List and Details Forms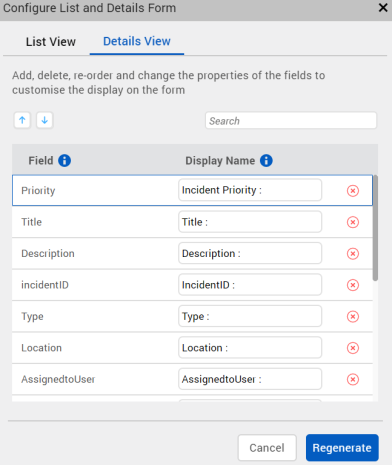
In Grid Forms
NOTE: The Display Name and Placeholder Text fields are not applicable for list (List Using Response) forms. And the Placeholder Text field is not available for detail (Details Using Response) forms.
- Configure the Read-Only and Required Properties: In the Configure Entry Form window, for the Priority field, select the Read-Only and Required check boxes.
Read-only fields signify that these fields cannot be edited by users. And Required fields signify that it is mandatory for users to specify the information for these fields; an asterisk is displayed on the UI for all Required fields.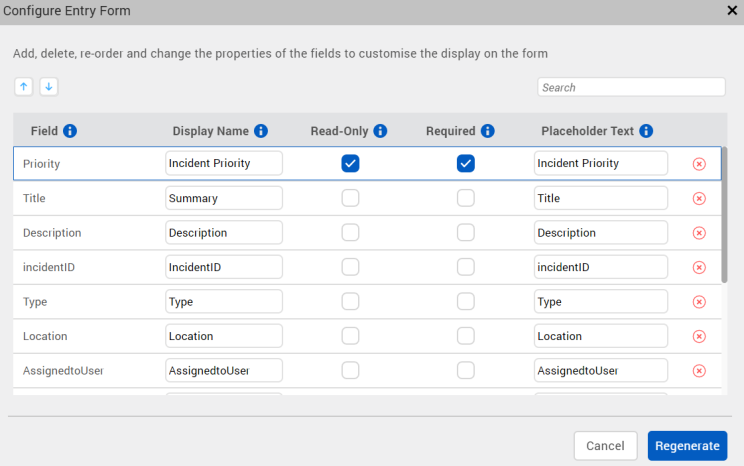
NOTE: The Read-Only and Required check boxes are only applicable in Entry forms; as part of the create and update methods. These check boxes are not available in List Using Response and Details Using Response forms.
- Delete/Add a Field: In the Configure Entry Form window, for the Priority field, click the Delete
 icon. The Priority field is removed from the top of the list, moved to the bottom, and the text is displayed in gray color.
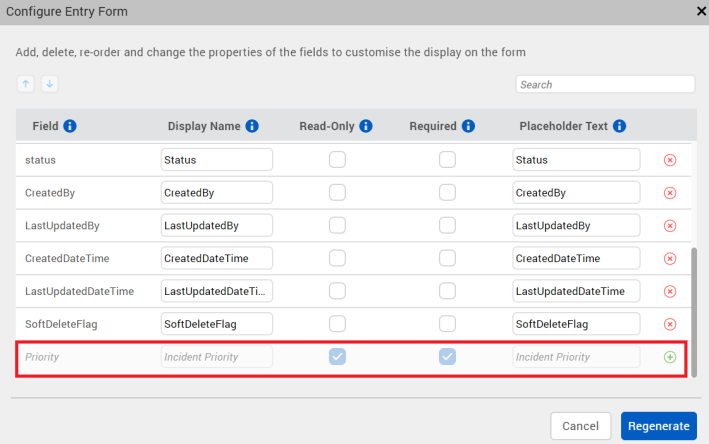
If you want to reinstate the Priority field, click the Add icon beside it. The Priority field becomes active again.
In List Using Response Forms
Delete Operation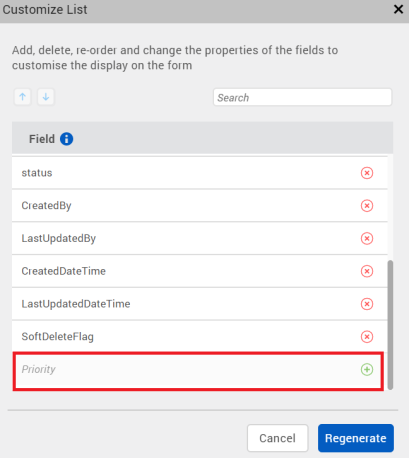
Add Operation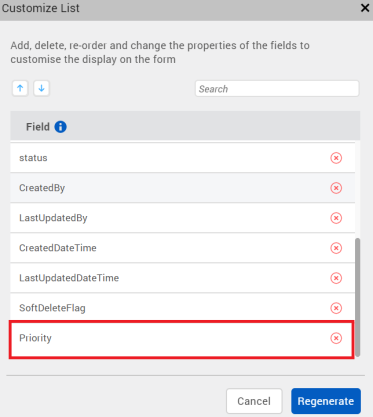
In Details Using Response Forms
Delete Operation
Add Operation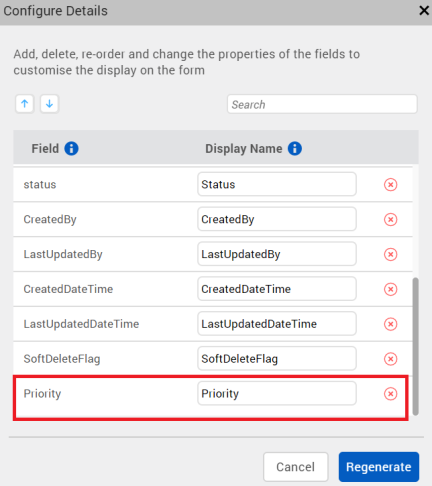
In List and Details Forms
Delete Operation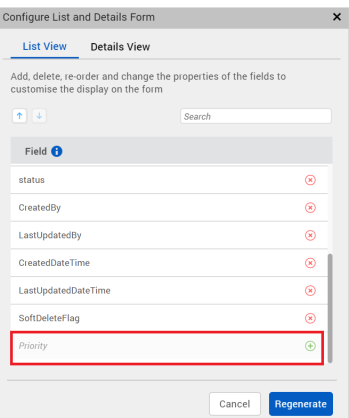
Add Operation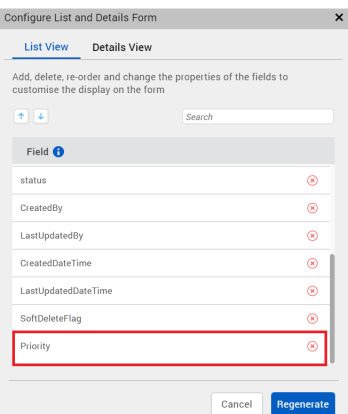
In Grid Forms
Delete Operation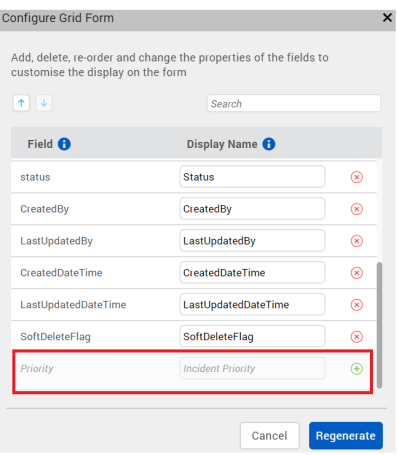
Add Operation
After you have performed the necessary operations for the Priority field in the Configure Entry Form window, click Regenerate. The dynamic properties of the Priority field are saved, and the updated frmCreate form is generated on the Project Canvas.
Set Data for the Segment in a Component
To map data for the Segment in a component for different channels, follow these steps:
- In Quantum Visualizer, create a component.
- Drag and drop a get method of an Integration or Object service (for example, getCountries) from the Data & Services panel onto the component that you just created. A dialog box appears asking you to select what type of form you want to generate: List Using Response or Details Using Response.
- Select the List Using Response option. A Segment (for example, seggetCountries) is added to the component, a list form is generated on the Project Canvas, and the mappings between various elements are auto-generated in Mapping Editor.
- On the Project Canvas, change the channel of the component from Mobile to Tablet, or vice-versa. For example, if you had been using the iOS Mobile: Native channel, change it to iOS Tablet: Native.
- On Project Explorer, select the Segment of the component, and go to Properties panel > Segment.
- For the Row Template list box, select the SampleRowTemplate option.
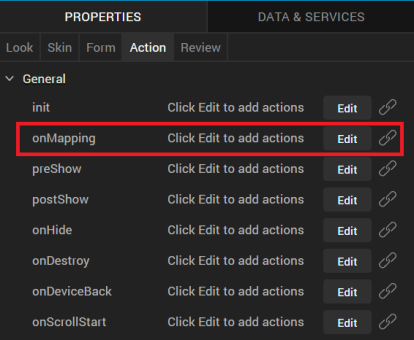
- On Project Explorer, select the parent FlexContainer of the component, and then go to Properties panel > Action.
- Under the Component section, for the onMapping Event, click Edit. The Action Editor window appears, with Diagram View open by default.
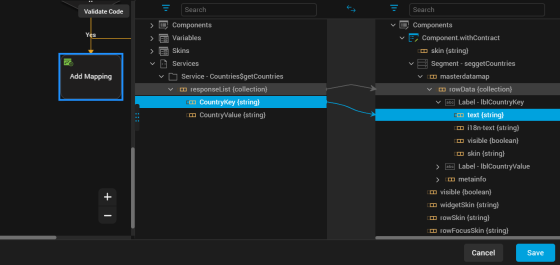
- In the flow diagram, click the Add Mapping action. Mapping Editor opens on the right pane of Action Editor.
- Map the required service parameters to the Segment rowData and associated rowData elements, as shown here.
- Click Save.
- Click Code View to see the code details of the data mappings.
For Mobile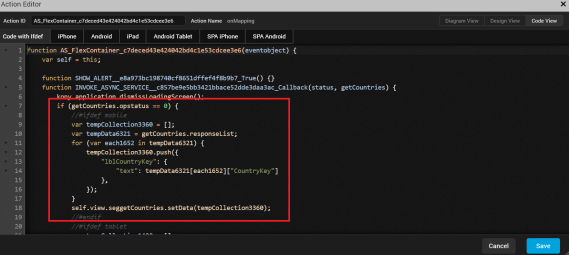
For Tablet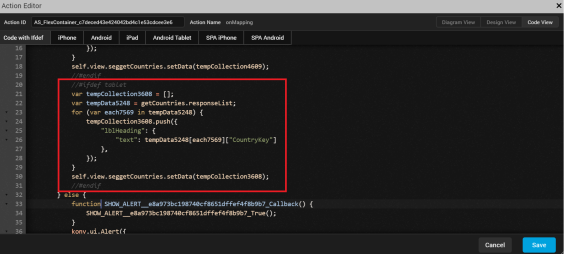
- Click Save. You have successfully mapped service parameters to the Row Data widgets of the Segment in a component for the Mobile and Tablet channels.
- If you build the project for Mobile channel, only the Mobile-related code will be used during run time. Similarly, if you build the project for Tablet channel, only the Tablet-related code will be used during run time.
Custom Verbs in Data and Services Panel
From Quantum Visualizer V9 SP2, the Data and Services panel lists the fields or attributes of a Custom Verb. You can drag and drop a Custom Verb from the Data and Services panel onto any Form. When a Custom Verb is added to a form, Quantum Visualizer displays a pop-up to select the templates for both Request and Response UI generation. This allows you to generate the Form UI for the Custom Verbs.
NOTE: Quantum Visualizer does not list the Request / Response fields of the Custom Verbs if the Object Service fields are not mapped to the respective sources (Integration Service Responses / Databases) in Quantum Fabric
The UI / Form generation for the Custom Verb is not considered while executing Generate Forms action associated with the Service.
Add Child Objects to a Form
From Quantum Visualizer V9 SP2, the Data and Service panel lists the Child objects. you can drag and drop the Child Objects from the Data and Services panel onto a form. Visualizer generates a custom UI for the Child Object and sends the metadata to the Quantum Fabric Console. This allows Visualizer to populate Object Service Response fields in the Data and Services panel.
When you add the Parent Object which contains Child Object onto a Form, UI is generated for Parent Object. Similarly, when you add the Child Object onto a Form, UI is generated for Child Object.
NOTE: When Include Related Objects checkbox is enabled for a Parent Object that contains Child Object. While sending the metadata of the Parent Object to Quantum Visualizer, the console includes the metadata of the Child Object. To know more on how to create a relation in Fabric. refer Fabric Object Services.
Associated Data & Services Panel Features
Quantum Fabric Node on the Data & Services Panel
From Quantum Visualizer V9, the Quantum Fabric node and associated actions have been shifted from the Project Explorer to the Data & Services panel. This feature has been introduced to enable a unified and enhanced user experience of using Quantum Fabric data and services from within Quantum Visualizer.
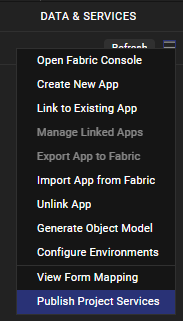
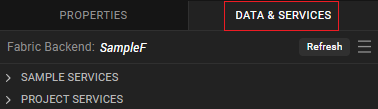
Click the hamburger menu icon ![]() at the upper-right corner of the Data & Services panel. From the list of options that appears, you can perform the following Quantum Fabric-related actions:
at the upper-right corner of the Data & Services panel. From the list of options that appears, you can perform the following Quantum Fabric-related actions:
- Open Quantum Fabric Console
- Create a Quantum Fabric app
- Link (your Quantum Visualizer project) to an existing Quantum Fabric app
- Export app from Quantum Visualizerto Fabric
- Import App from Fabric to Quantum Visualizer
- Unlink a Quantum Fabric app from your Quantum Visualizer project
- Configure Quantum Fabric environments
- View form mapping of linked Project Services
- Publish your Quantum Visualizerapp to Quantum Fabric
Mapping Event
Mapping event is available in the Mapping Editor. Service invocations dropped on a form or a FlexContainer in a canvas are mapped to the mapping event .
NOTE: If you add code to the preshow event dynamically, the new code added will override the mapping event.
View Mapping
When View Mapping is selected for a service on the data panel, the associated action is displayed.
If more than one action sequence is associated to a service, a fly-out menu is displayed with a drop-down list. You can select the Mapping Action Sequence you want to view. This opens the Action Editor. For more information, refer Action Editor.
Manual Refresh
You can refresh the data in the Data & Services panel manually by using the Refresh button. When you click Refresh, the Data & Services panel fetches the latest data from your associated Quantum Fabric application. You can use this Refresh button to update any changes you made to your Quantum Fabric service by using the Quantum Fabric console, from within Quantum Visualizer.
Service Invocation
When a network call is made to invoke an async service, the action sequence appears in the Data & Services panel. For containers, when you drag and a drop an operation or the response from the data panel, the async service invocation is added to the mapping event. Response parameters are auto-generated on the form. You can also invoke an Identity service by using the drag-and-drop feature onto a login form. Network actions are used to generate the service invocation.
Highlighted View of Mapped Widgets
When you select a service or its associated operation from the Data & Services panel, the mapped UI elements are highlighted on the form.
When the Data & Services panel goes out of focus or if you select another form, the highlight effect disappears.
Delete Mapped Widgets
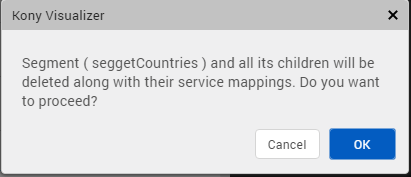
You can delete any mapped widget that is mapped to services by right-clicking the widget, and then selecting Delete. Visualizer displays a confirmation pop-up before you can proceed with the widget deletion. The display of this alert helps prevent any accidental deletions and service failures. Click Ok to delete the widget and all its children widgets along with the service mappings.
Action Sequences
The following action sequences are auto-generated for responses.
Loading Indicator
When enabled, the loading progress of a service call is displayed until the response is completed. You also have the option to not display (dismiss) the loading indicator.
Data Type Conversion
When you map a non-matching data type, a popup appears alerting you of the same. The non-matching data type is then implicitly converted before being mapped.
NOTE: The Calendar Date data type is not converted. But if the date property of a Calendar widget is mapped to the Date field of an Object service, the date is converted to ISO format at run time and is sent to the back end. When this date is read during run time, the ISO format of the date is converted back to the DD-MM-YYYY format.
NOTE: You cannot map Boolean and Date fields to widget positional properties such as left, top, right, and bottom.
If you want to view the data type conversion, click Generate Code in the Action Editor.
The following data types are converted:
- Boolean
- String
- Number (can be further converted as int and float)
Status Check
The Data & Services panel auto-generates actions to perform a service status check and map the widgets on the success of the service call.
You can also define your own IF condition blocks by using the Action Editor.
Send Data between Two Forms
Previously, if you wanted to send data from one form to another, you had to save the data in a global variable first and then you would be able to use it. From Quantum Visualizer V8 SP4, you can send data between two forms by using Action Editor. You can enter any data, such as an object or a variable, in the Action Editor UI and then send it to another form.
To send data between two forms, follow these steps:
- In Quantum Visualizer, create a new project.
- Create two new forms; for example, say frm1 and frm2.
- Add a button to frm1.
- Select the button, and then go to Properties > Action.
- For the onClick Event, click Edit. The Action Editor appears.
- From the list of actions on the left, scroll to the Navigation section, and then click Navigate to Form. The navigation action is added to the button.
- In the lower section of the Action Editor, select frm2.
NOTE: Alternatively, you can click Create New to create a new form; say, frm3. And set the onClick navigation for the button to frm3.
- Select the Pass data with navigation check box. The form frm1and all of its widgets are listed in a nested structure along with defined local Variables, if any.
- You can select the required widget data properties or local variables of frm1 to pass data on navigation from frm2. As you select multiple widget properties, the Navigation Object is constructed as key-value pairs.
- Click View Code to view the default code for the Navigation Object that has been constructed.
Alternatively, you can select the Custom Input check box to create your customized Navigation Object or navigation flow data. - Click Generate Code to verify the data that is sent to frm2.
To use the data that is received from frm1, follow these steps:
- Click frm2, and then go to Properties > Action.
- For the onNavigate Event, click Edit. A confirmation dialog box appears stating that if you have already defined the onNavigate Event in FormController, the current action will not be respected.
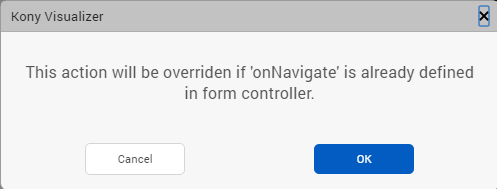
- Click Ok. The Action Editor appears.
- From the list of actions on the left, scroll to the Functions section, and then click Add Snippet. The code snippet is added to frm2.
- Click Generate Code. For this action sequence, you can access the data from the eventobject argument. This is the same argument that was passed from frm1.
- Click Close.