
Standard Reports Configuration
Generating a Report
To generate a standard report, follow these steps:
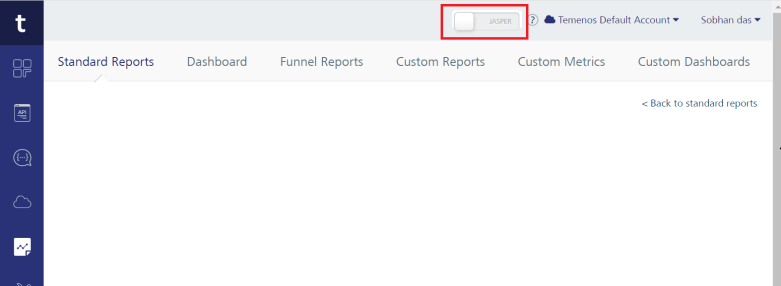
- Sign in to Quantum Fabric.
- Click the JASPER to POWERBI switch for accessing Power BI reports.
NOTE: You can access the JASPER or POWERBI switch across the Fabric Console.
IMPORTANT: The JASPER or POWERBI switch is available only on AWS until May 31.
-
Click the CONTINUE.
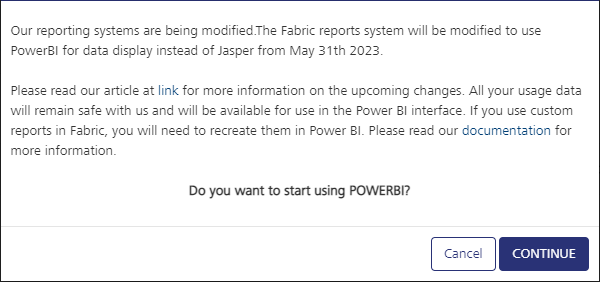
The Power BI reports mode is on in your Fabric.
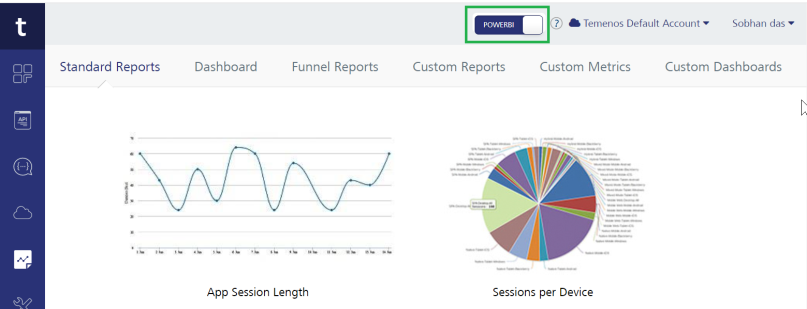
- From the left navigation panel, click Reports. The Standard Reports tab is selected by default.
- On the Standard Reports tab, select the report tile you want to generate. The Select Environments dialog box appears, and it lists the name of environments of the account that contains the data.
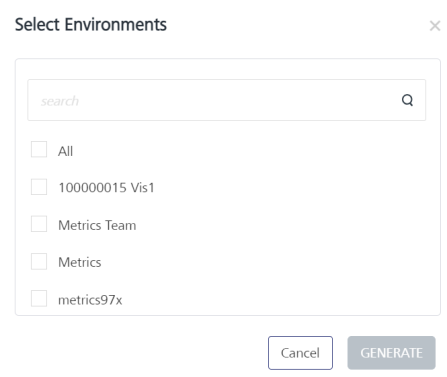
- Select one or more check boxes for the listed environments. To select all the environments, select the check box for All.
You can enter an environment name in the Search text box, for finding a specific environment. - Click GENERATE. The standard reports for the chosen tile will be generated based on the selected environments.
The report will be displayed in the Standard Reports dialog box that appears. For example, the Application Usage Detail report.
NOTE: The report is attached to the Filters section. The report is generated based on the default filters set.
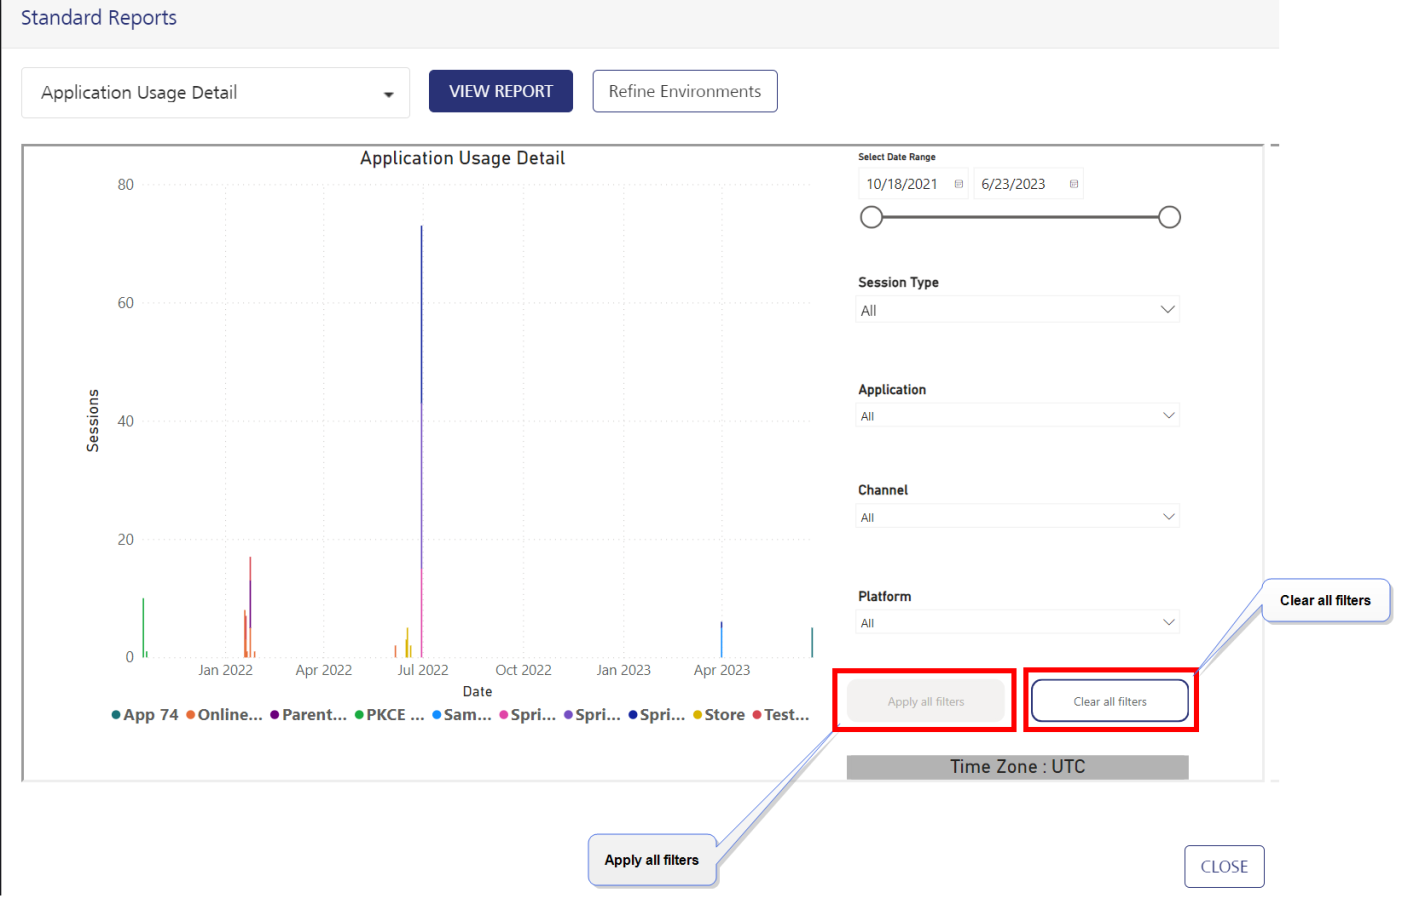
NOTE: All reports are generated based on dates/time in Coordinated Universal Time (UTC) time zone.
Managing Filters for Standard Reports

Apply all filters Helps you to utilize all filters. The button is initially inactive. Once you have selected new filters, the button will become active.
To set the filter parameters, select options from the provided list and then click the Apply all filters button. This will update the report with the new filter values.For more information on filters, refer to Reports Filter Criteria.
Clear all filters To remove all applied filters. click the Clear all filters button. This action will revert the report back to its default filter settings.
Viewing all Reports
To view reports for the rest of the tiles, select the report type from the drop-down list, and click VIEW REPORT in the Standard Reports dialog box.
- To generate reports based on a specific environment/s, select the Refine Environments button.
- Select the check boxes for environments.
- Click GENERATE. The standard reports for the chosen tile will be generated.
The following section helps you how to interact with reports.
Interaction with Power BI reports
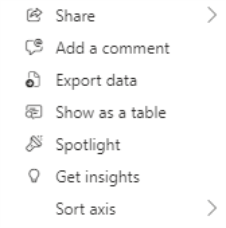
Once you create Power BI reports, you can interact with the reports such as getting in-depth details, exporting reports, and navigating to aggregation levels.
Hover on a report to view the interaction options as shown in the following table:

|
|
|
Drill mode:
|
To drill in-depth details of the elements in the report.
For more details, refer to Power BI Drill mode in the Power BI service Documentation. |
|
To pin a visual to a dashboard |
|
To save a Power BI report as an image |
|
|
|
Focus mode lets you expand (pop out) a visual or tile to see more detail |
Exporting Standard Reports
You can download standard reports by using the Export feature. You can download a report in the following formats:
- Excel (.xlsx)
- CSV (.csv)
To download a standard report, follow these steps:
- Generate a report by using the earlier method.
- Click More Options (...) in the generated report window, and click Export data option.
- Select the required option from the dialog that appears, and then click Export.
The selected format of the report is downloaded to your local system.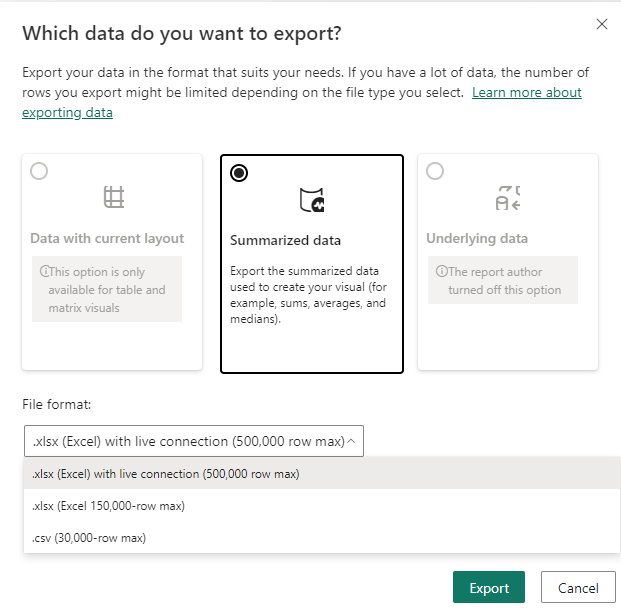
The following table provides information about the supported data export formats of each report.
| Excel | CSV | |
|---|---|---|
| Active Users |

|
|
| App Crash Breadcrumbs |
|
|
| App Session Length |
|
|
| Application Error Detail |
|
|
| Application Error Summary |
|
|
| Application Usage Detail |
|
|
| Application Usage Summary |
|
|
| Event Activity |
|
|
| Event Summary |
|
|
| Frequency of App Usage |
|
|
| New Users |
|
|
| Object Service Performance |
|
|
| Object Service Performance Detail |
|
|
| Requests per Form |
|
|
| Requests per Service |
|
|
| Service Duration |
|
|
| Service Duration Detail |
|
|
| Service Performance |
|
|
| Service Usage Detail |
|
|
| Service Usage Summary |
|
|
| Sessions per Device |
|
|
| Time Spent per Form |
|
|
| US Map of User Activity |
|
|
| World Map of User Activity |
|
|