
Creating a Custom Report
To create a custom report, follow these steps:
- Log on to Quantum Fabric Console.
-
Click the JASPER or POWERBI switch to toggle between JasperReports Server and Power BI Reports Server.
NOTE: You can access the JASPER or POWERBI switch across the Fabric Console.
IMPORTANT: The JASPER or POWERBI switch is available only on AWS until May 31.
- Click the Custom Reports tab, and click CREATE REPORT.
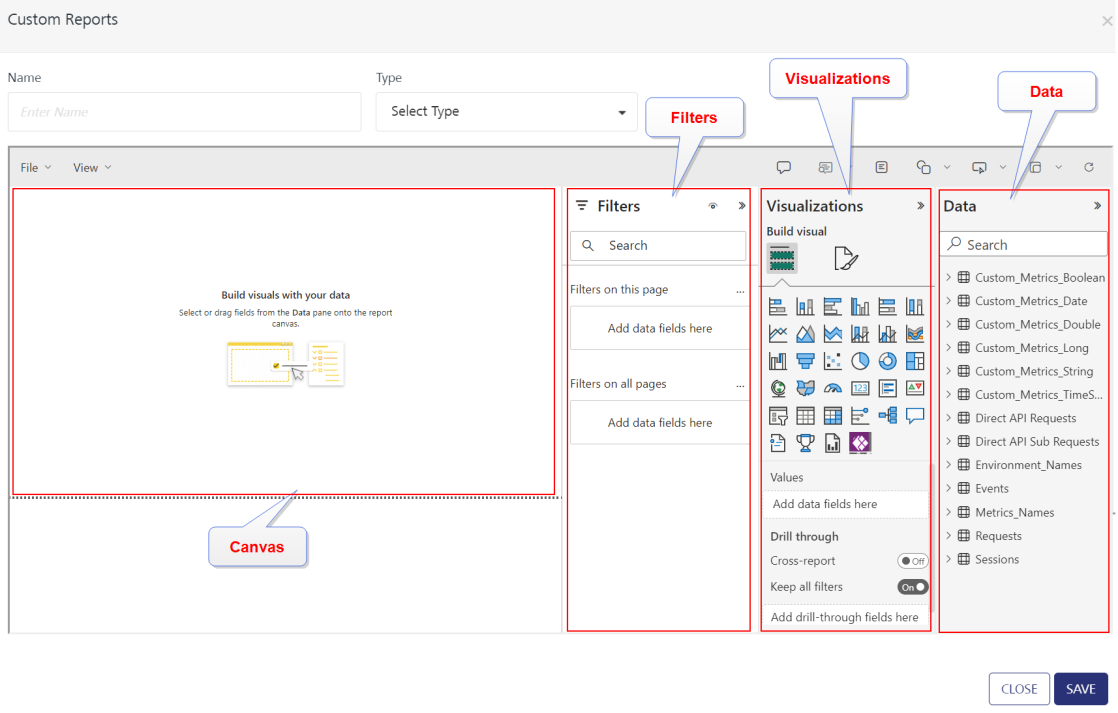
The Quantum Fabric loads the Power BI Custom Reports designer in the displayed Custom Reports dialog. There are different user interface sections available for configuring reports, as follows:
 Click for more details on Power BI Custom Reports designer:
Canvas The Canvas section allows you configure visuals for different reports.
Filters This allows you filter data sets by configuring default filters and your own filters.
Filter on this visual: All the configured filters are applied to a selected visual. The Filters on this visual filter is added only when you add a visual to the Canvas.
Filters on this page: All the configured filters are applied to all the visuals in the active page of the canvas.
Filters on all pages: All the configured filters are applied to all the visuals in all the pages of the canvas.
Visualizations This allows you to configure several types of visuals for your reports.
Data This lists all the custom metrics tables, standard reports tables, and data sets that are used for creating Standard Reports and Custom Metrics. This data contains data of all apps in multiple clouds in a specific Fabric account.
Custom Metrics tables:
Custom Metrics tables are categorized based on the data types:
- Custom_Metrics_Boolean
- Custom_Metrics_Date
- Custom_Metrics_Double
- Custom_Metrics_Long
- Custom_Metrics_String
- Custom_Metrics_TimeStamp
The custom metrics tables hold the data of a specific metrics data of that data type. Each table of a data type used to create custom metrics for all the apps.
For example: The Custom_Metrics_Boolean table holds all Boolean metrics data that is used to create custom metrics for all the apps.
Standard tables:
This displays all the standard tables used to crate standard reports and dashboards.
Direct API Requests
- Direct API Requests are similar to Requests except that the requests are made directly to the API endpoint, instead of client app built using Fabric SDK.
Direct API Sub Requests
- Direct API Sub Requests are similar to Subrequests except that the calls are made directly to the API endpoint, instead of client app built using Fabric SDK.
- Subrequests are requests within the context of another request, such as integration service invoked within an object service.
NOTE: For more information on GDPR Policy and Encoding of PII in metrics, refer to Runtime Configuration > GDPR Policy
- Direct API Sub Requests are similar to Subrequests except that the calls are made directly to the API endpoint, instead of client app built using Fabric SDK.
Events: Events table contains an entry for every event that the client app generates as part of the project settings. Quantum Fabric SDKs can send data on the application events to track the journey of a user in the app. The APIs can report standard app events such as Form Entry, Form Exit, Service Request, Touch, Gesture, and Orientation. The APIs can also report error events and app crashes. You can use the data in the table to analyze the app flows that a user takes, how much time a user spends on a form, or how often does the app crash or cause an error. One session can contain several application events based on how a developer configures the app.
Metrics_Names
Requests:
- Requests table contains an entry for every service invocation to the Fabric server such as integration, object, and orchestration service. This dataset is used while analyzing the server-side service performance, checking the volume of service calls. One session contains several service requests.
Sessions:
- Sessions is a dataset used to retrieve the information such as the number of times the app is used, the number of users who used the app, the location where the app is accessed, and OS versions of the app. This table contains an entry for every time the user launches the app or when the app comes to the foreground after being in the background for more than 30 minutes. It is used as a default dataset for building reports. If you do not have any requirements from other datasets, it is recommended to use only session dataset for building reports because it has the least volume of records and helps to build the reports faster.
IMPORTANT:With the latest changes in the Custom Metrics, you can pull all the application related fields directly from the Custom Metrics view instead of pulling it from the Requests view. This will accelerate the report creation process.
- While retrieving the data for custom metric fields from Custom Metrics or Custom Metrics - Direct API views, you will get the data for both Direct API and Quantum SDK requests by default.
To differentiate between the Direct API data and Quantum SDK data, do the following:
- Add a filter on the sdktype field.
- Pass the following conditions and values in the sdktype field:
- For Direct API(Custom Metrics - Direct API view) requests, use the equality condition with the value as api.
- For Quantum SDK(Custom Metrics view) requests, use the non-equality condition with the value as api.
Environment_Names This allows you to filter data based on environments of all clouds in an account.
-
Enter the report name in the Name text box.
-
Select the Type either Public or Private.
-
Public indicates the reports will be accessible to other users who can access to reports in the account.
-
Private indicates the reports will only be accessible to the current user who created them in the account.
-
-
Add the visual to the Canvas.
-
Navigate the required visual under the Visualizations pane.
-
Click the visual. The selected visual is inserted into the Canvas. You can add more than one visual to the Canvas.
-
The Filters on this visual filter is added to the Filters section only when you add the visual to the Canvas.
-
The Filters on this page and Filters on all pages are the standard filters.
-
-
The additional properties are added to the Visualizations pane for the selected visual.
-
-
Configure the filters for visuals.
-
Select a visual in the Canvas.
-
From the Data pane, expand the tables and drag-and-drop the required columns to designated filters and additional properties sections.
The following table details you to manage filters:
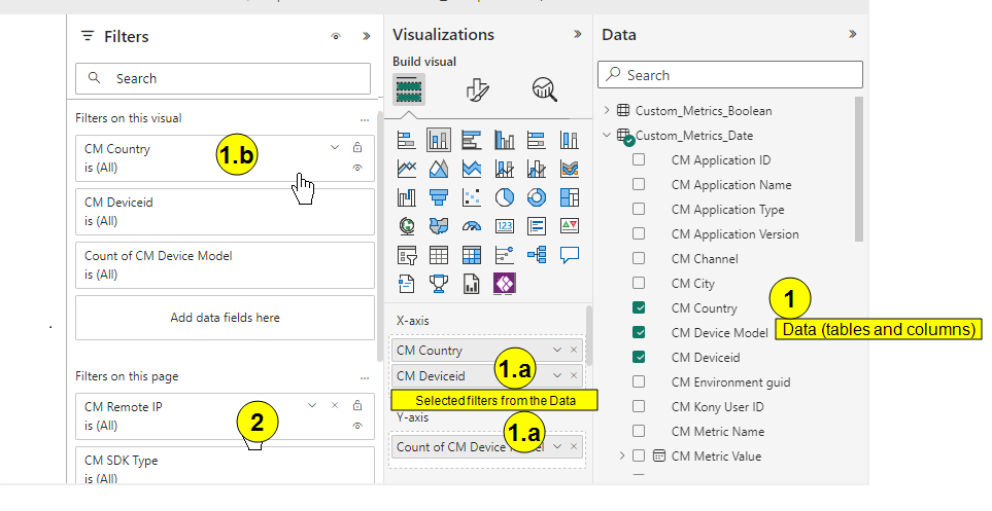
1
-
You can expand tables in the Data section and select check box/s for the columns to add them to the selected visual
1.a
-
You can configure filters in the Visualizations pane for the selected visual—for example, X-axis and Y-axis.
-
You can either delete or expand/collapse these filters using this section.
1.b -
When you add filters to Visualizationssection, these filters are applied in the Filters on this visual sectoin automatically.
-
You can expand/collapse, lock, and hide.
-
When you lock a filter, you cannot perform any actions on that filter while you are viewing the report.
-
When you hide a filter, the filter is not visible while you are viewing the report.
-
2 -
You can configure additional filters for the Filters on this page and Filters on all pages for the selected visual in the Canvas.
-
You can expand/collapse, delete, lock, and hide these filters.
-
When you lock a filter, you cannot perform any actions on that filter while you are viewing the report.
-
When you hide a filter, the filter is not visible while you are viewing the report.
-
-
As you start configuring columns in the filters and properties, the visuals instantly display the results in the Canvas.
-
Click SAVE to save the report. The report is saved and displayed on the Custom Reports home page.