
Reports
Quantum supports two reporting systems, TIBCO Jasper Reports Server and Microsoft Power BI Server.
The Reports page displays standard reports, dashboards, funnel reports, custom reports, metrics, and dashboards.
The user experience varies of creating analytics and reports and viewing reports between these reporting systems.
You can choose to switch between one of these reporting systems as follows:
-
Log in to your Quantum Fabric.
-
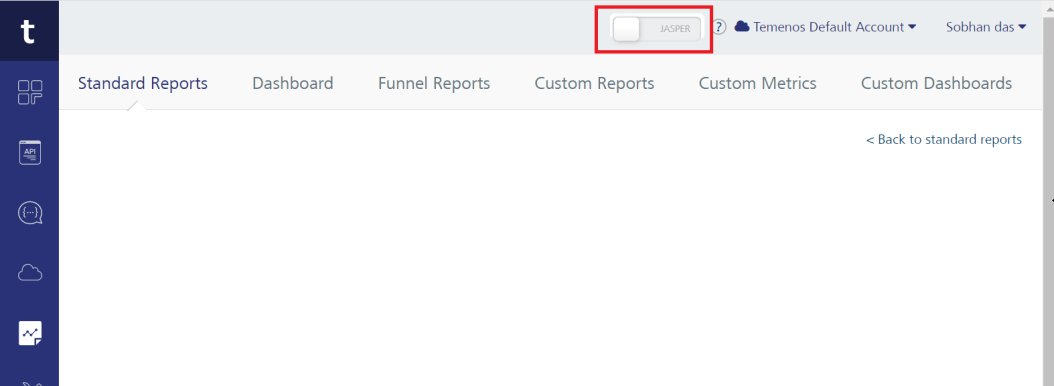
Click the JASPER or POWERBI switch to toggle between JasperReports Server and Power BI Reports Server.
NOTE: You can access the JASPER or POWERBI switch across the Fabric Console.
IMPORTANT: The JASPER or POWERBI switch is available only on AWS solution on manage.temenos-cloud.com until May 31, 2023. -
Click the CONTINUE.
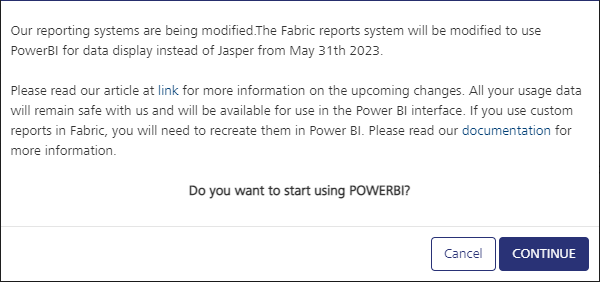
The Power BI reports mode is on in your Fabric.
-
Click the Reports page. The data is loaded from the reports server in the Reports page based on the selected reporting server.
Refer to the following sections for more information.
TIBCO JasperReports Server
IMPORTANT: Support for TIBCO Jasper Reporting Server on AWS Temenos Cloud is unavailable from May 31, 2023.
IMPORTANT: For Quantum On-Premise only: To access the reports, you must configure the JasperReports Server by clicking the Configure Reporting Server button. For more details on how to configure the reporting server, click here.
- For standard reports and dashboard information, refer to Standard Reports and Dashboard documentation.
- For information on funnel reports, refer to Funnel Reports documentation.
- For information on custom reporting, refer to Custom Reporting – Metrics, Reports, and Dashboard documentation.
Microsoft Power BI
IMPORTANT: From 202305 onwards, Quantum Fabric supports Microsoft Power BI as the new reporting software for Temenos-managed AWS solution on manage.temenos-cloud.com
-
Power BI Standard Reports and Dashboard
Learn how to use various metrics and reports to gain insights into application activities, User activities, geolocation, server requests, and performance in Quantum Fabric. Refer to Quantum Power BI Standard Reports and Dashboard Guide.
-
Power BI Custom Metrics, Reports, and Custom Dashboard
Understand the procedures to capture custom metrics from an application and build reports using the metrics. Refer to Quantum Power BI Custom Reports and Dashboard Guide.