Working with Custom Dashboards
Working with custom dashboards includes the following:
- Creating a Custom Dashboard
- Viewing a Custom Dashboard
- Updating a Custom Dashboard
- Deleting a Custom Dashboard
Creating a Custom Dashboard
You can create a new custom dashboard from the Custom Dashboard screen.
To create a custom dashboard, follow these steps:
- Log on to Quantum Fabric Console.
The Quantum Fabric Console home page appears.
-
Click the Toggle switch to POWERBI to access Power BI reports.
- Click Reports from the left pane of the screen.
The Reports window appears displaying Standard Reports by default.
- Click theCustom Dashboards tab.
The Custom Dashboards page appears.
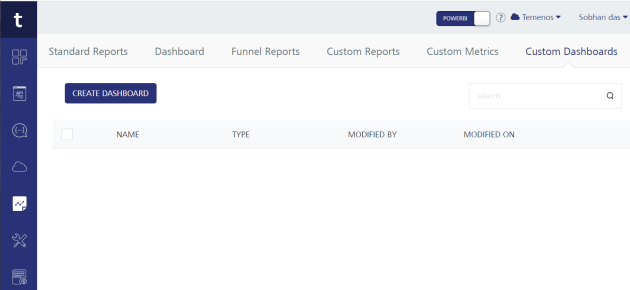
- Click CREATE DASHBOARD to create a new dashboard.
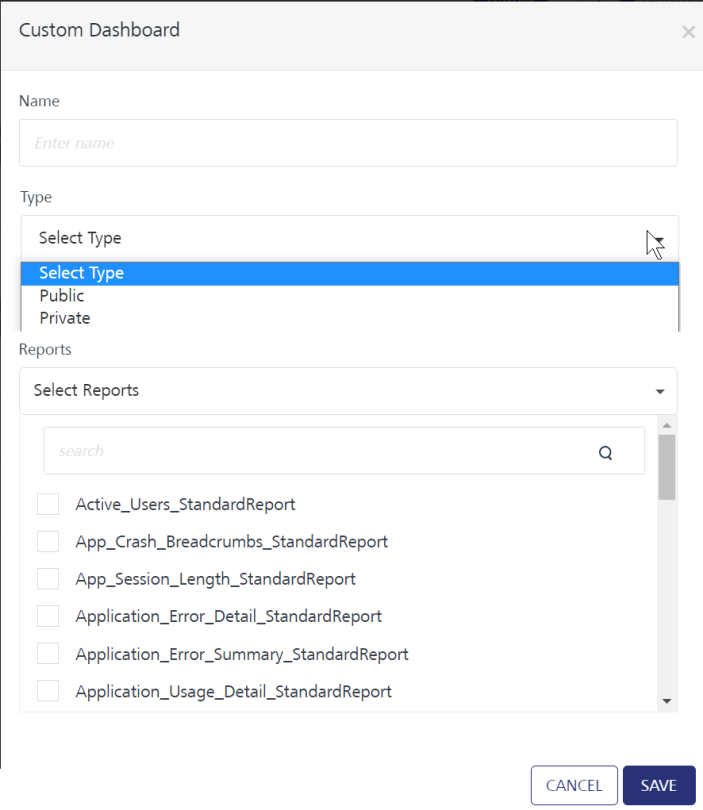
The Custom Dashboard Designer dialog displays the name field, type, and list of accessible reports (standard reports and custom reports) from the Report list section.
- Perform the following actions to save the created dashboard:
- Add the name of the dashboard in the text box provided.
- Select the type from the list.
- Select the required check box/s from the list for standard reports and custom reports.
- Click SAVE. The custom dashboard is created.
Viewing a Custom Dashboard
You can view the dashboard created from the Custom Dashboards page.
To view the created custom dashboard, follow these steps:
- Go to the Custom Dashboards page.
A list of Custom Dashboards is displayed.
- Click the custom dashboard entry. You can click More Options > View Dashboard (a circle with three dots) displayed across each row.
Dashboard View page appears, including the associated reports in it.
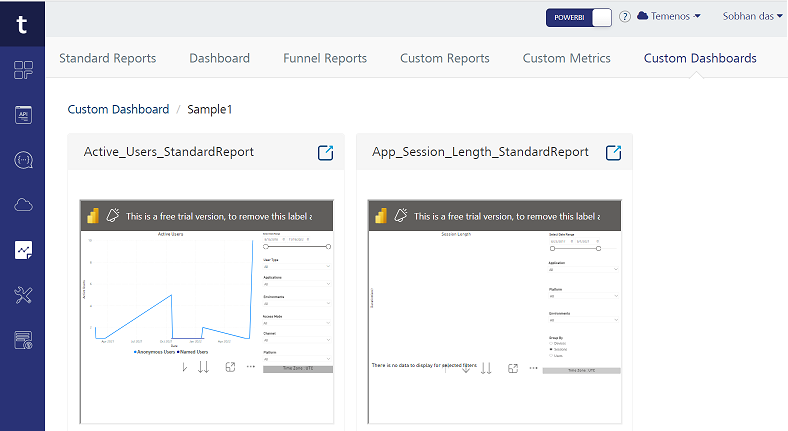
- Click Focus mode to expand a report and apply filters to view the results.
-
Click X from the upper right corner of the designer page to close the dashboard view page.
Updating a Custom Dashboard
You can update the custom dashboard from the Custom Dashboards screen.
To edit and update a custom dashboard, follow these steps:
- Log on to Quantum Fabric Console and click Reports from the left pane of the screen.
- Click the Custom Dashboards tab.
A list of created custom dashboards is displayed.
- Click More Options (a circle with three dots) displayed across each row of the created custom dashboard.
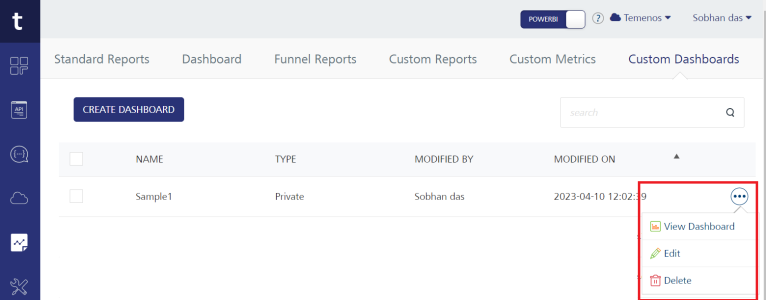
- Click Edit to edit the selected custom dashboard.
The Custom Dashboard dialog appears. The view of the dialog is similar to the creation view of the custom dashboard.
-
Change the name, type, and reports sections as required.
IMPORTANT: You cannot edit the dashboard name for the dashboards created by other users.
- Click SAVE. You can edit the dashboard name, change the type, and clear the check boxes for reports to remove the existing ones and select check boxes for new reports.
The save option overrides the current dashboard with the new changes.
Deleting a Custom Dashboard
You can delete the created dashboard from the Custom Dashboards window.
To delete a custom dashboard, follow these steps:
- Log on to Quantum Fabric Console and click Reports from the left pane of the screen.
- Click the Custom Dashboards tab.
A list of custom dashboards created is displayed.
- Click More Options (a circle with three dots) displayed across each record.
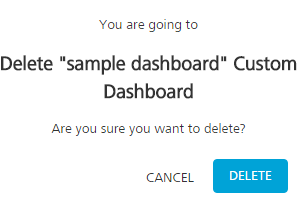
- Select Delete to delete the selected dashboard.
A confirmation dialog appears.
- Click DELETE.
The selected custom dashboard is deleted.